
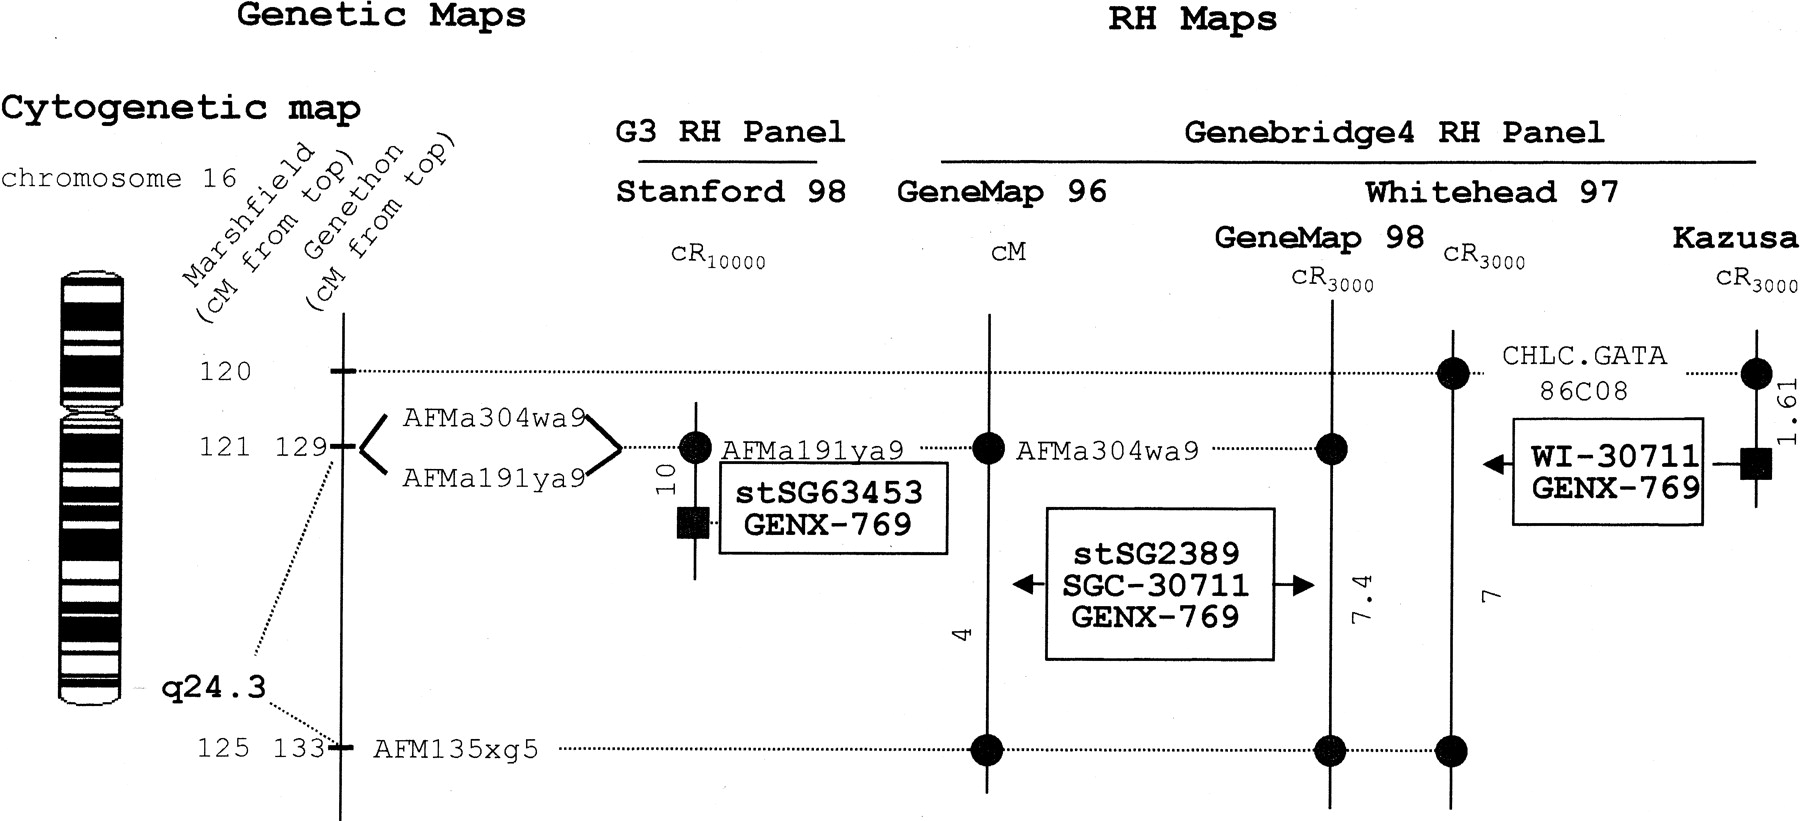
Localization of the GENX-769 gene in the integrated genome maps. The cytogenetic map presented is based on GENATLAS data. The genetic map is displayed with a scale in centiMorgans (cM) from the top of the chromosome according to the Marshfield (CHLC) and the Généthon maps. When the mapping result is expressed as a distance (with a significant lodscore) to a framework marker theGENX-769 marker is represented by a square. When localized in a given interval, the GENX-769 marker is written inside a box and points to this interval with a black arrow for odds >10:1 or lod score >1, a gray arrow for odds <10:1 or lod score <1. The microsatellites or other markers are reported as circles. The distances between markers of the RH maps are indicated in centiRay10000 (cR10000) for the G3 RH panel, in cR3000 for Gene Map ’98, Whitehead ’97, and Kazusa maps and in cM for Gene Map ’96. D numbers or aliases (AFMa304wa9) D16S3061; (AFMa191ya9) D16S3037; (AFM135xg5) D16S520; (CHLC;GATA86C08) 16S2625.


