
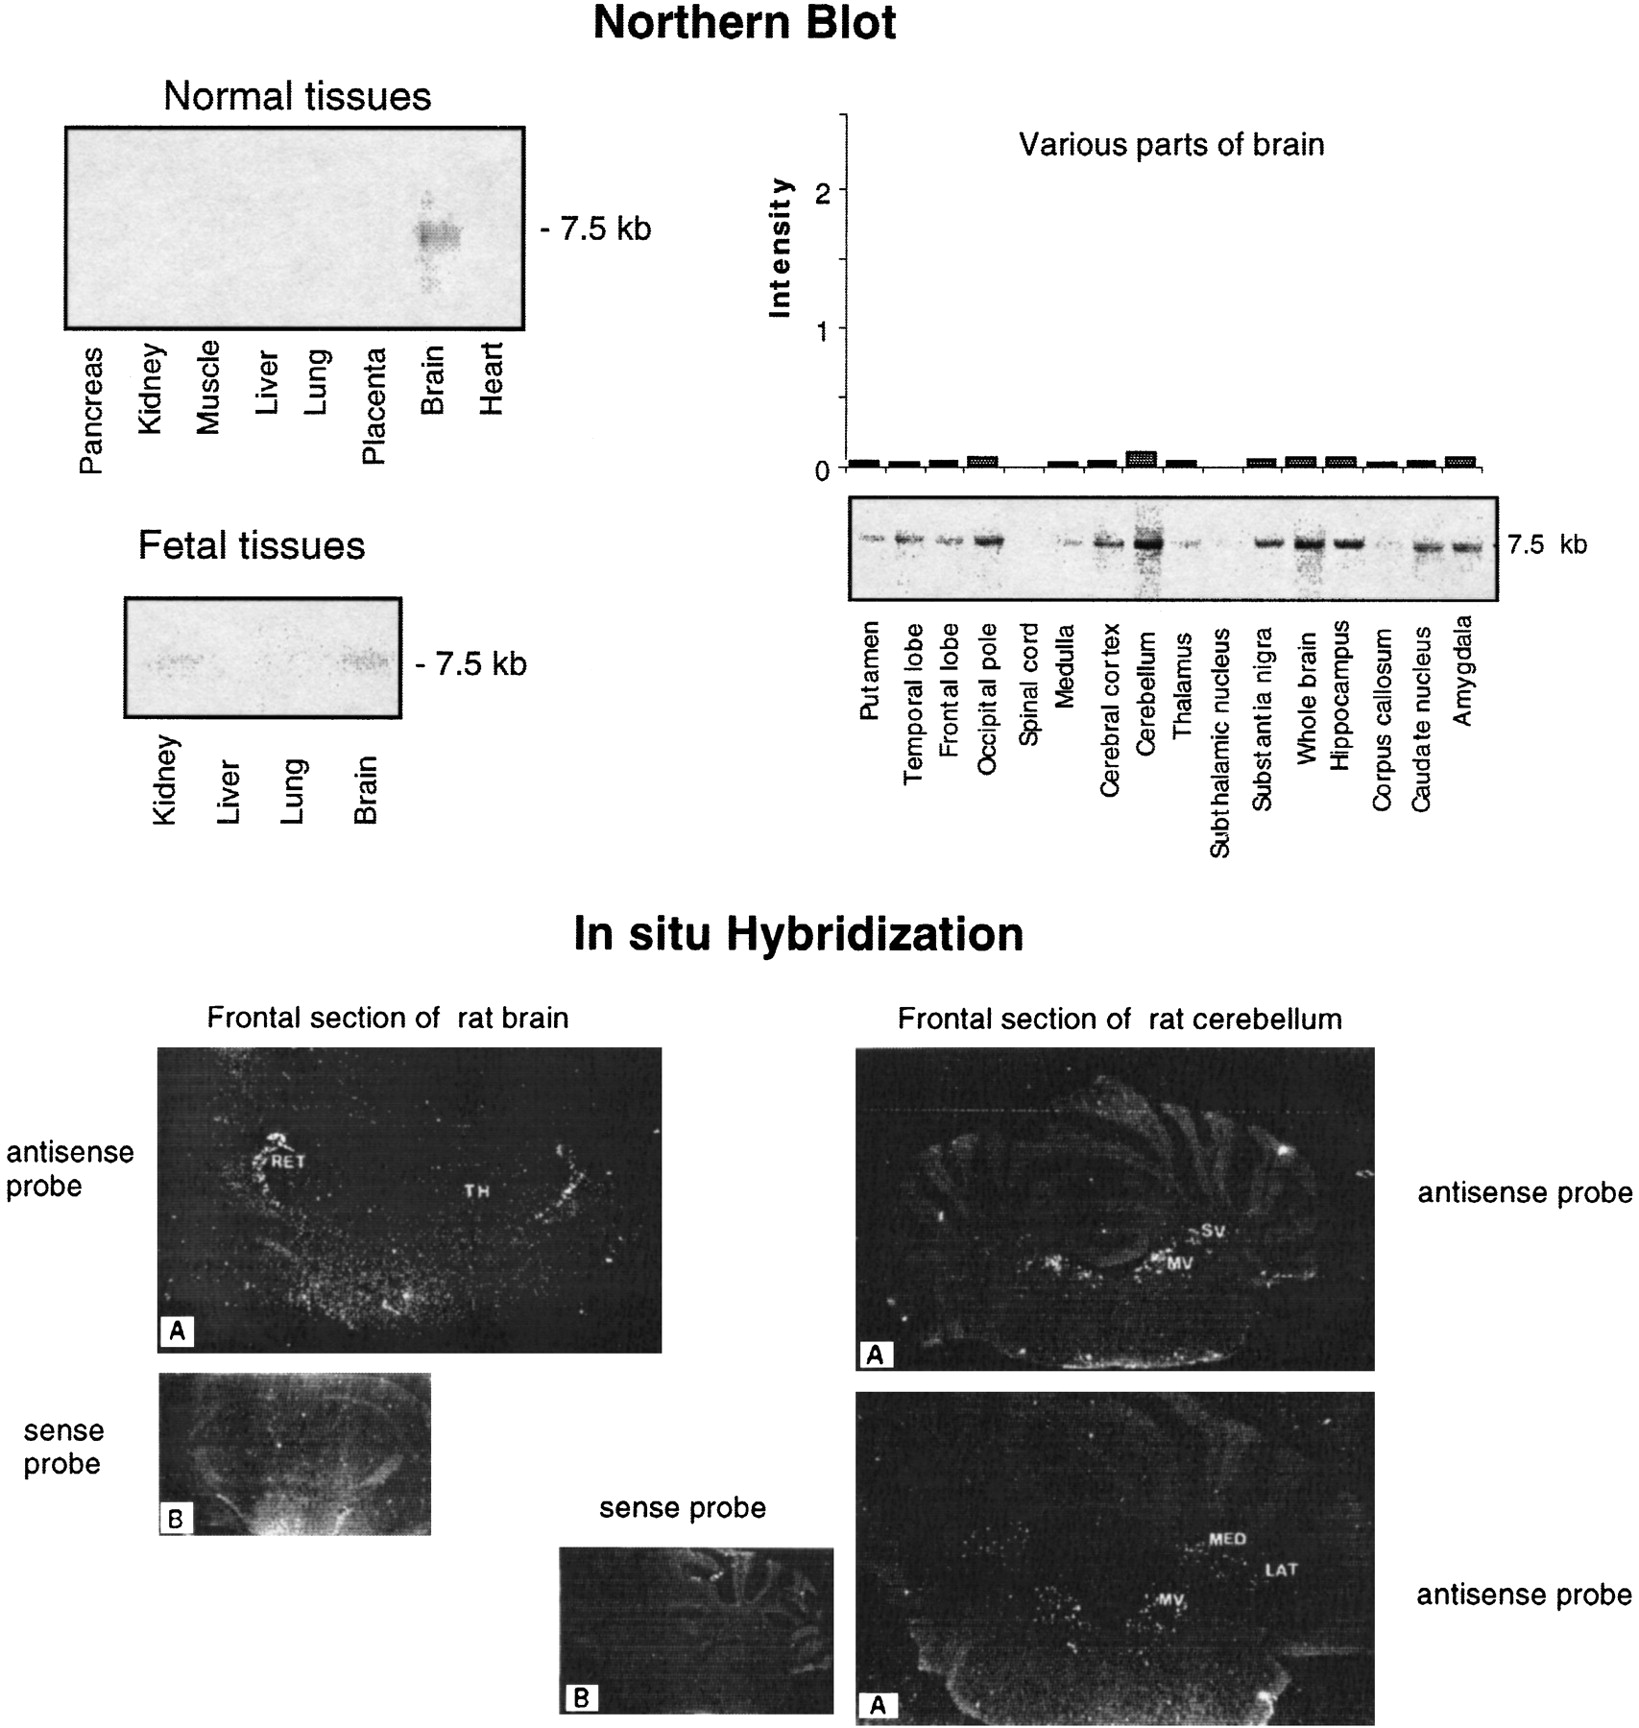
Expression profiles of the GENX-769 mRNA. (Top) Northern blot analysis of the GENX-769 transcript in 8 normal tissues, 15 regions of brain, and 4 fetal tissues. The insert of cDNA clone c-08e08 (IMAGE-57147) was used as a probe. The size of the transcript is indicated in kb. Each lane contained 2 μg of poly(A)+ mRNA from the various human sources. For expression in 15 regions of brain, intensity signals observed on Northern blots was quantitated using ImageQuant software (Molecular Dynamics). To normalize the signal in relation with the quantity of RNA in each lane and compare variations from one tissue to another, each value was divided by those obtained by hybridization of the Northern blots with ubiquitous control actin and ubiquitin cDNA probes to control the amount of mRNA. The signal intensity is represented in arbitrary units. (Bottom) In situ hybridization of GENX-769. Rat brain coronal sections through the diencephalon hybridized with antisense (A) and sense (B) probes. Only the reticular nuclei (RET) in the thalamus (TH) are labeled. A very weak signal is observed in the hippocampus (Ammon’s horn and dentate gyrus). On sections through the cerebellum, labeled cells are localized in the medial vestibular (MV) and superior vestibular (SV) nuclei, and in the medial (ME) and lateral (LAT) cerebellar nuclei.


