
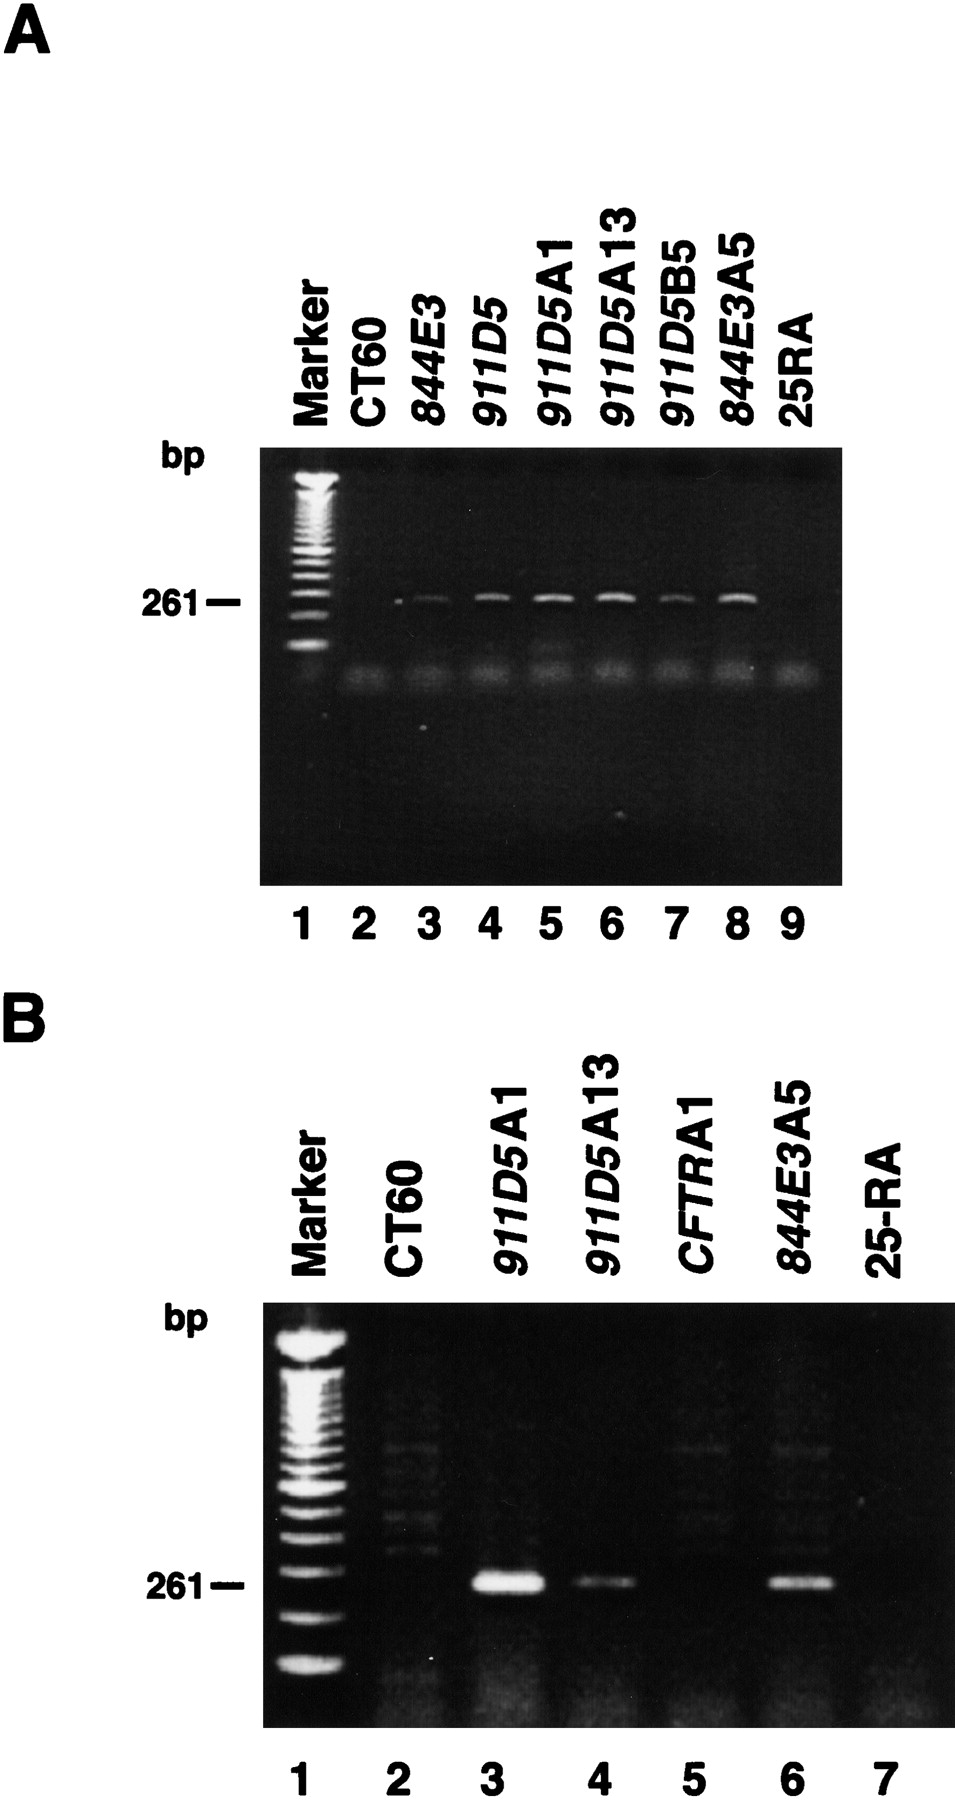
Mapping and expression analysis of the RDA gene fragment 2-R. (A) Ethidium bromide-stained agarose gel of PCR products amplified from the genomic DNA templates listed above lanes 2–9 by use of primers based on the sequence of 2-R. The genomic DNAs are from cell lines unless otherwise indicated. (Lane 1) 100-bp marker; (lane 2) CT60; (lane 3) YAC 844E3; (lane4) YAC 911D5; (lane 5) 911D5A1; (lane 6) 911D5A13; (lane 7) 911D5B5 [another complemented cell line derived from fusion of CT60 with YAC911D5 (Gu et al. 1997)]; (lane 8) 844E3A5; (lane 9) 25-RA. The expected size of the PCR products is 261 bp as indicated. (B) Ethidium bromide stained agarose gel of RT–PCR products obtained by use of RNA from the cell lines and primers based on the sequence of 2-R. (Lane 1) 100-bp marker; (lane2) CT60; (lane 3) 911D5A1; (lane 4)911D5A13; (lane 5) CFTRA1; (lane 6)844E3A5; (lane 7) 25-RA. The expected size of the RT–PCR products is 261 bp as indicated.


