
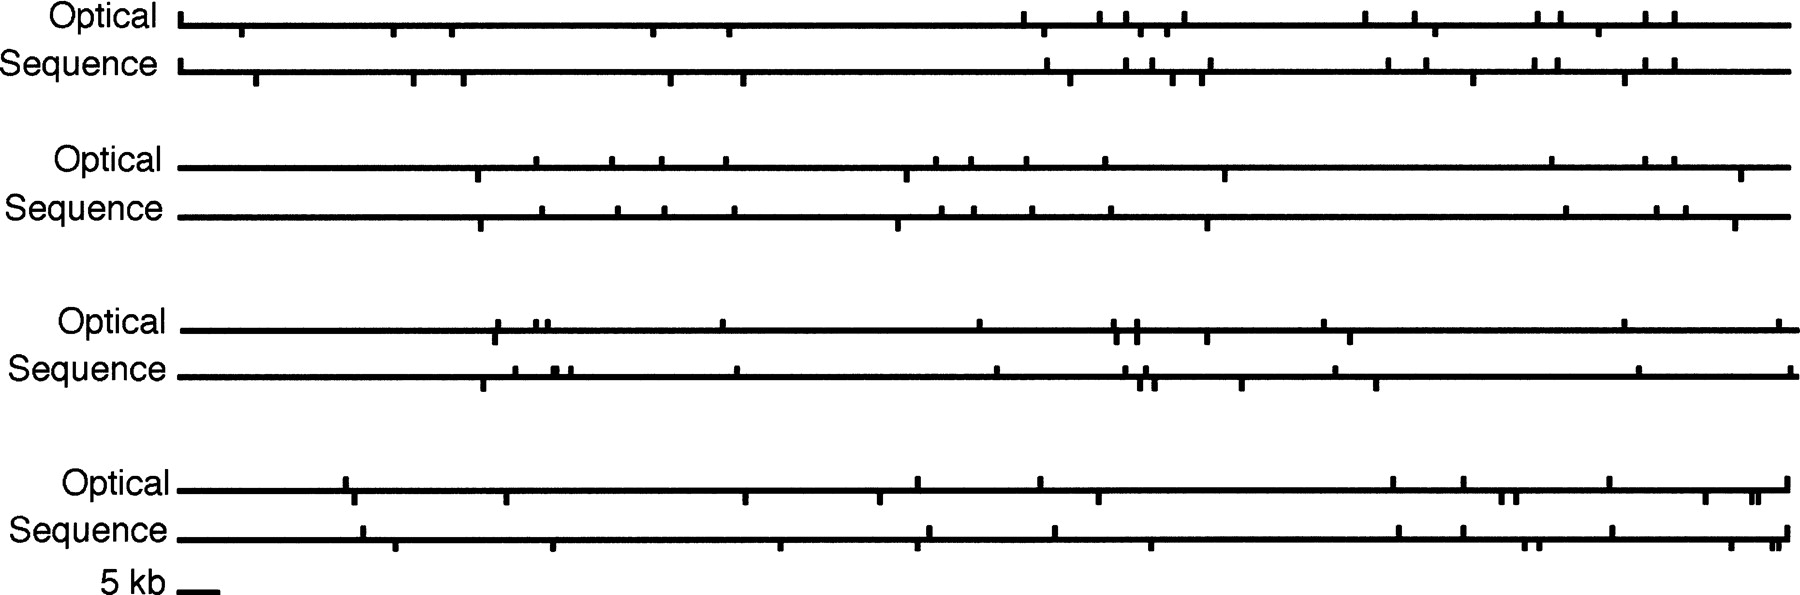
Figure 3.
The use of sequence information to link single enzyme maps. The top map was generated by normalizing the single enzyme maps to be the same size (961 kb). The resulting multienzyme map was aligned with the map predicted from sequence. The median relative error is 7%. The average absolute error is 1.4 kb. Upper tick marks are NheI sites; lower tick marks are BamHI sites.


