
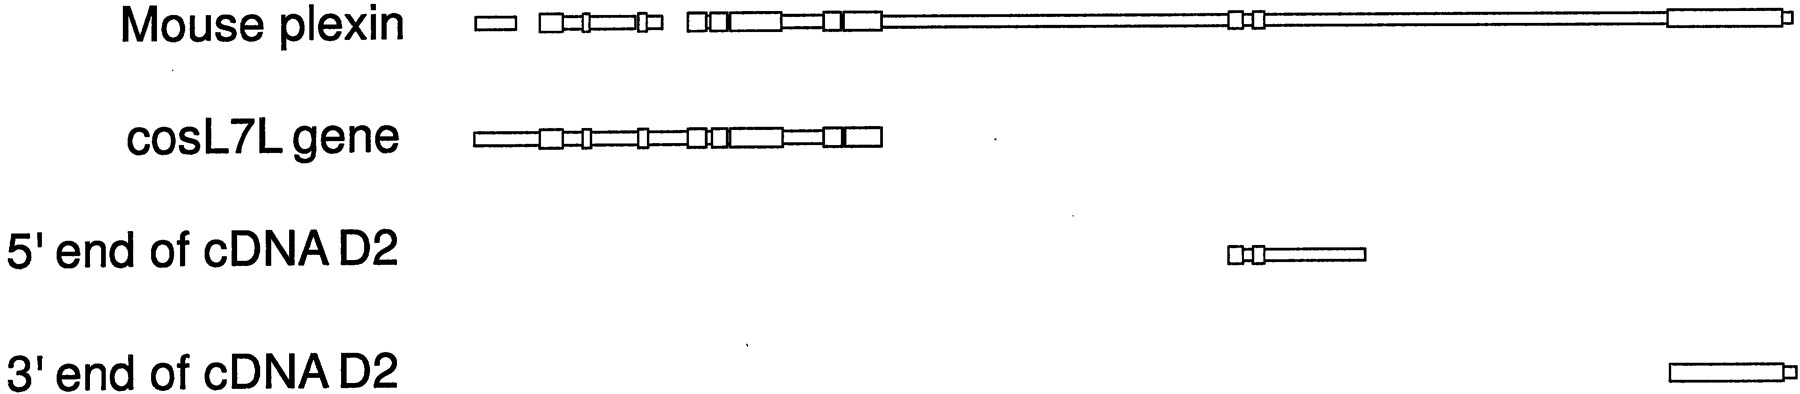
Figure 7.
A diagram showing the alignment of blocks of similar deduced amino acid sequence between the mouse plexin (Kameyama et al. 1996) and the sequences from clones cosL7L and the 5′ and 3′ ends of cDNA clone D2 (as shown in Fig. 1). Thick regions indicate blocks of similar sequence aligned among the sequences; whereas thin regions indicate regions without similarity.


