
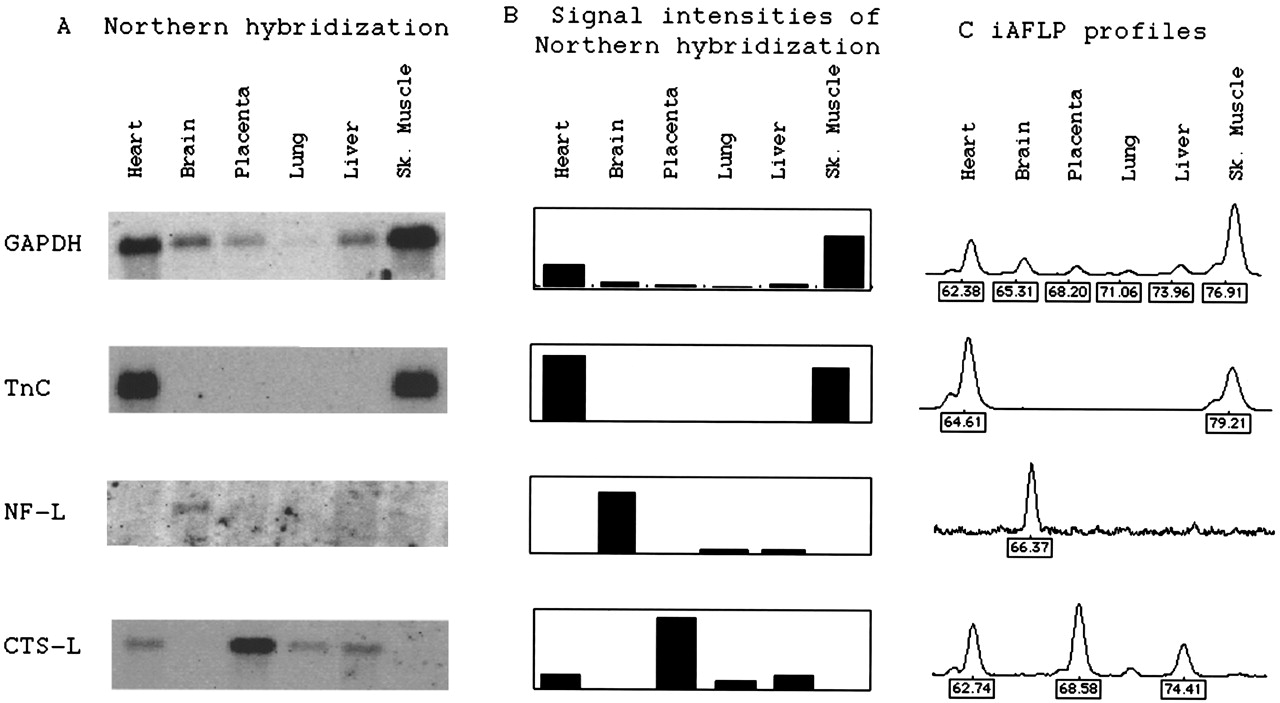
Figure 3.
Comparison of Northern hybridization results with iAFLP profiles. The same set of six human tissue poly(A) RNAs was used for Northern blotting and cDNA synthesis in template pool preparation for iAFLP profiling. For each gene, Northern hybridization signals (A), intensities of those signals (B), and an iAFLP profile (C) are shown. Values below the iAFLP profile are sizes assigned for peaks by the GenScan software (PE Biosystems). On thex-axis is fluorescence intensities in arbitrary units measured by 377 sequencer (PE Biosystems). (GAPDH) Glyceraldehyde-3-phosphodehydrogenase; (Tn C) cardiac troponin C; (NF-L) neurofilament L; (CTS-L) cathepsin L.


