
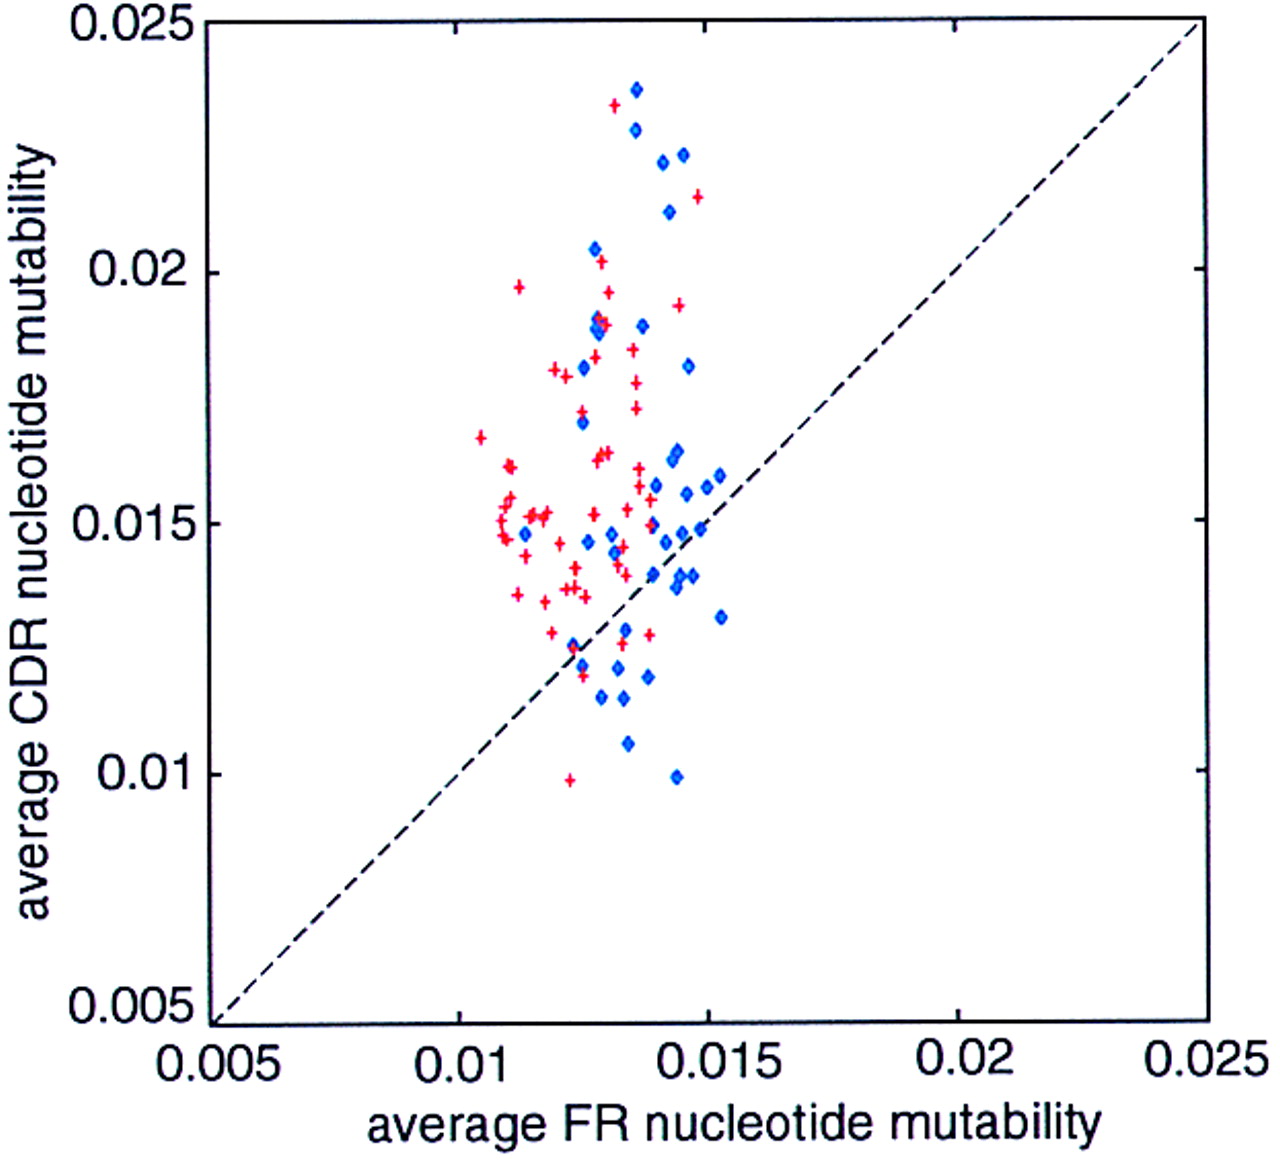
Figure 6.
Scatter plot of the predicted FR vs. CDR nucleotide mutability values for the set of human TCRα (blue) and TCRβ (red) sequences.
(Downloading may take up to 30 seconds. If the slide opens in your browser, select File -> Save As to save it.)
Click on image to view larger version.
Scatter plot of the predicted FR vs. CDR nucleotide mutability values for the set of human TCRα (blue) and TCRβ (red) sequences.
 CiteULike
 Delicious
 Digg
Digg Facebook
 Google+
 Reddit
 Twitter
