
Figure 5.
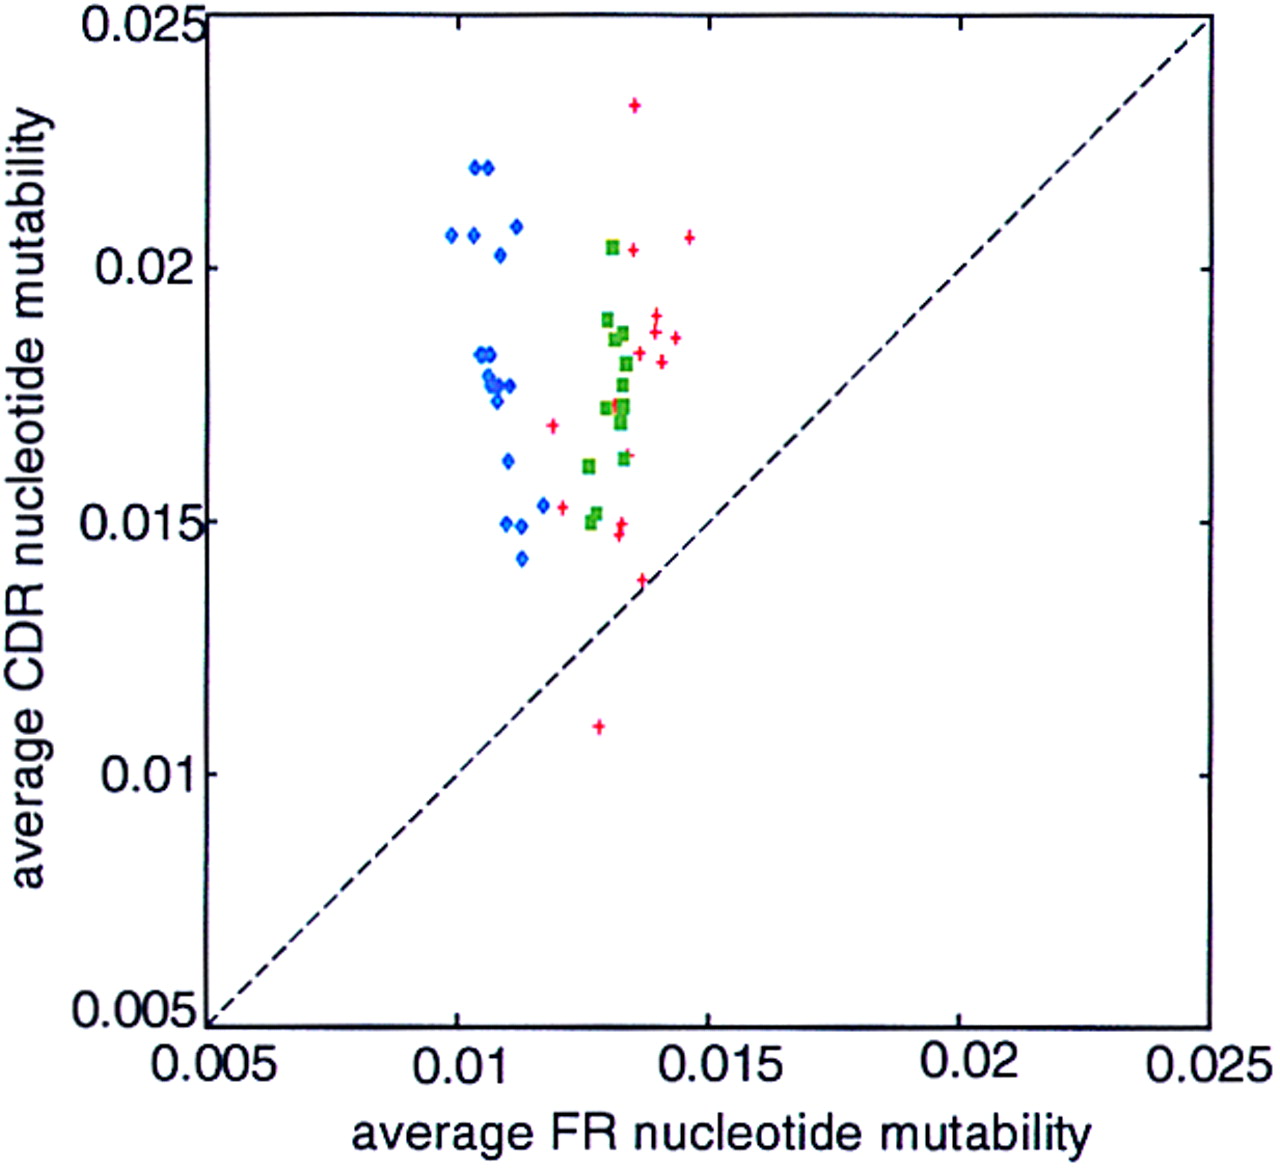
Scatter plot of the predicted average replacement mutability of CDR vs. FR nucleotides for: sheep V λ (blue), horned sharkVH (green), rainbow trout VH (red).
(Downloading may take up to 30 seconds. If the slide opens in your browser, select File -> Save As to save it.)
Click on image to view larger version.
Scatter plot of the predicted average replacement mutability of CDR vs. FR nucleotides for: sheep V λ (blue), horned sharkVH (green), rainbow trout VH (red).
 CiteULike
 Delicious
 Digg
Digg Facebook
 Google+
 Reddit
 Twitter
