
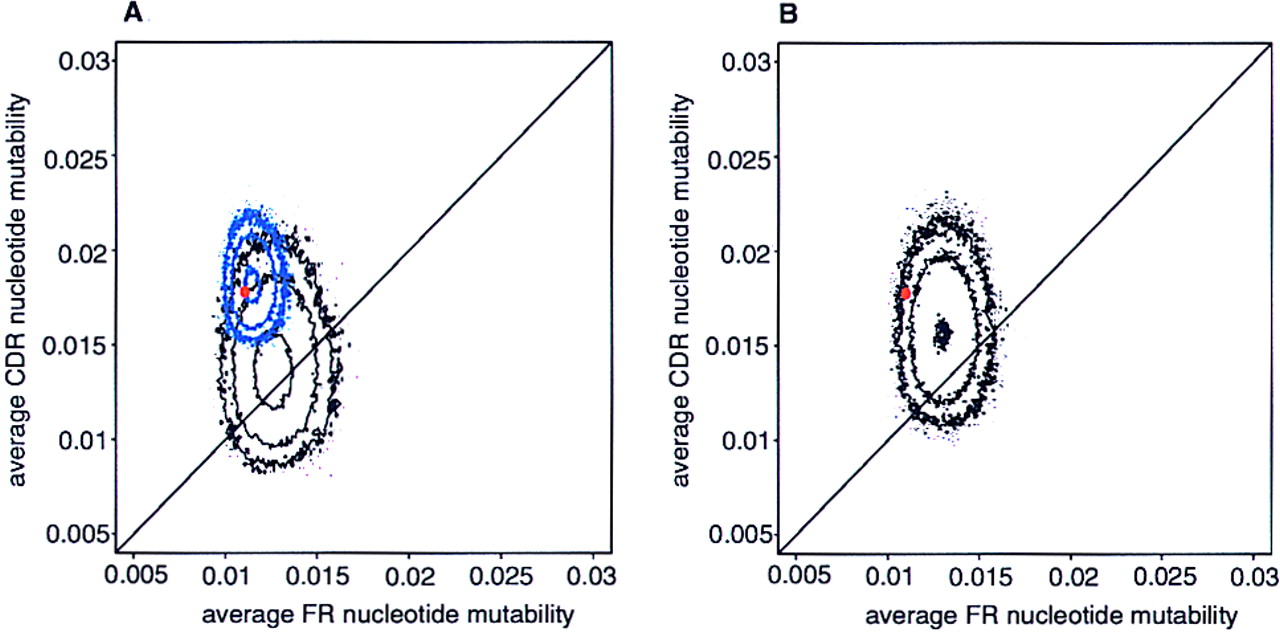
Figure 1.
Contour plot of the predicted average FR vs. CDR mutability of VH 6-1 variants: (A) 105sequences identical nucleotide composition (black), 105sequences with similar codon composition (blue); (B) 105 sequences with identical amino acid translation (black). The contour levels are drawn at 1, 10, and 100 sequences. The actual gene is shown in red.


