
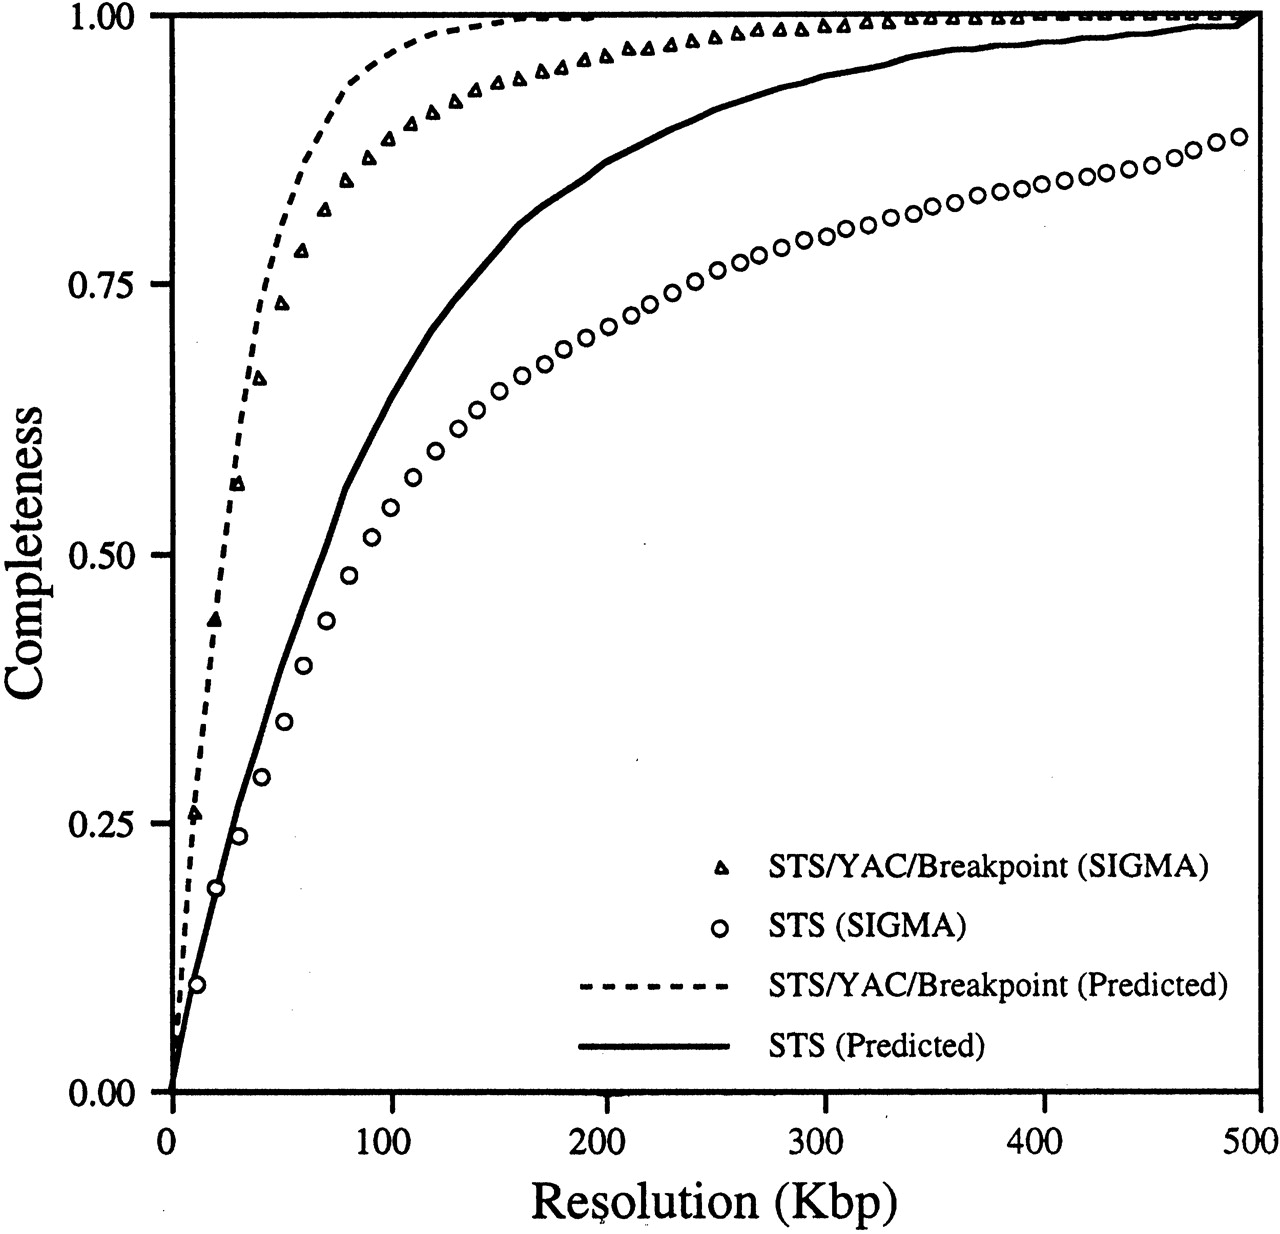
Completeness at resolution graph for the YAC/STS/Hybrid breakpoint (BP) map. The location of each STS, YAC end, and hybrid breakpoint (data points) was extracted from the SIGMA map. A window of given size was moved that distance down the chromosome. For each interval, it was determined whether any data points were contained within the window. The result of different window sizes was evaluated at regular intervals to create the plot. (▴) The curve generated by use of STSs, YAC ends, and BPs; (○) the curve for the STSs alone. The predicted completeness at resolution curves (broken line for STS/YAC/BP and solid line for STS alone) were obtained by randomly placing the same number of sites on the map.


