

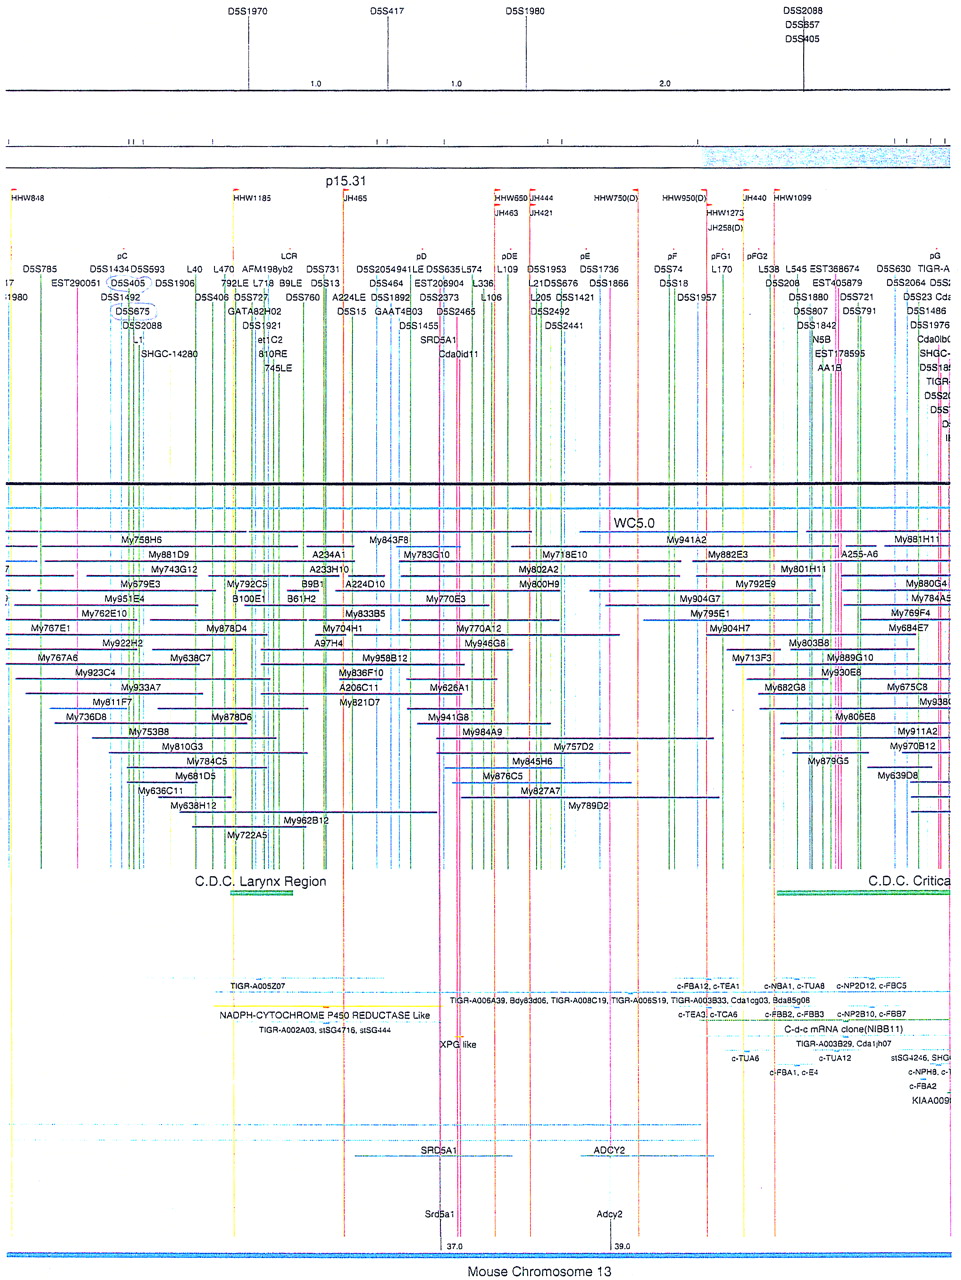
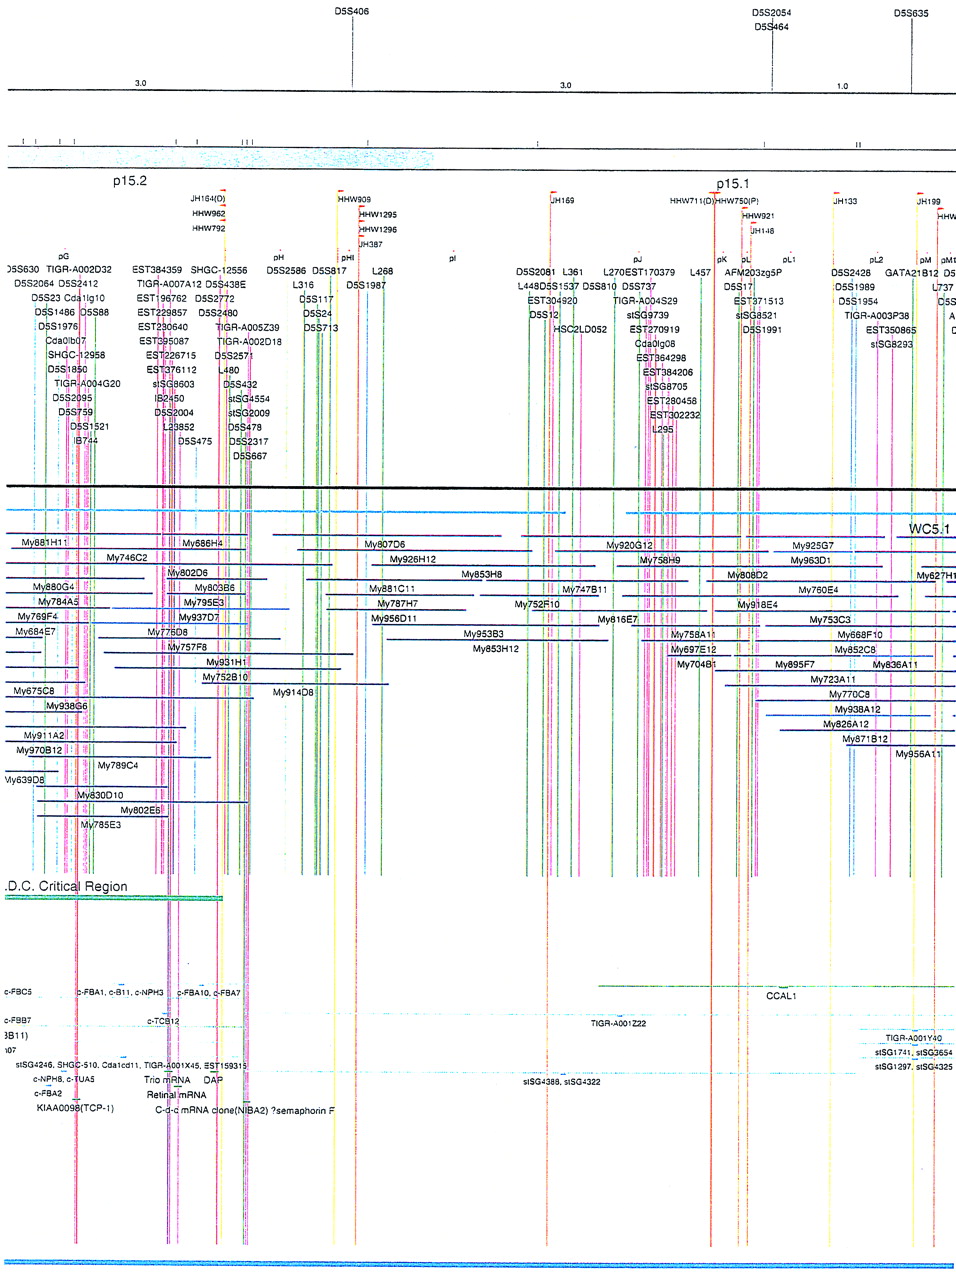
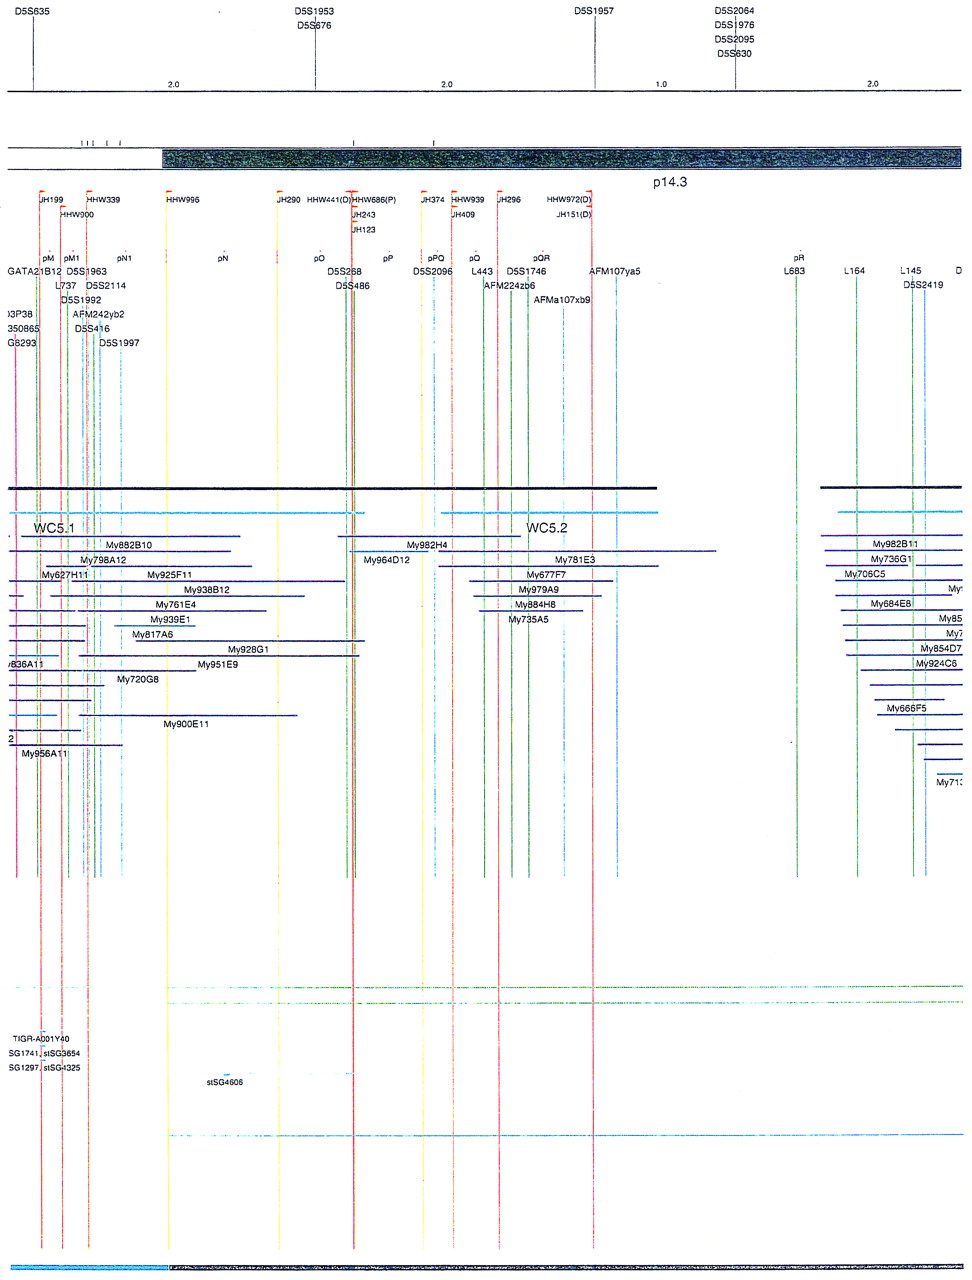
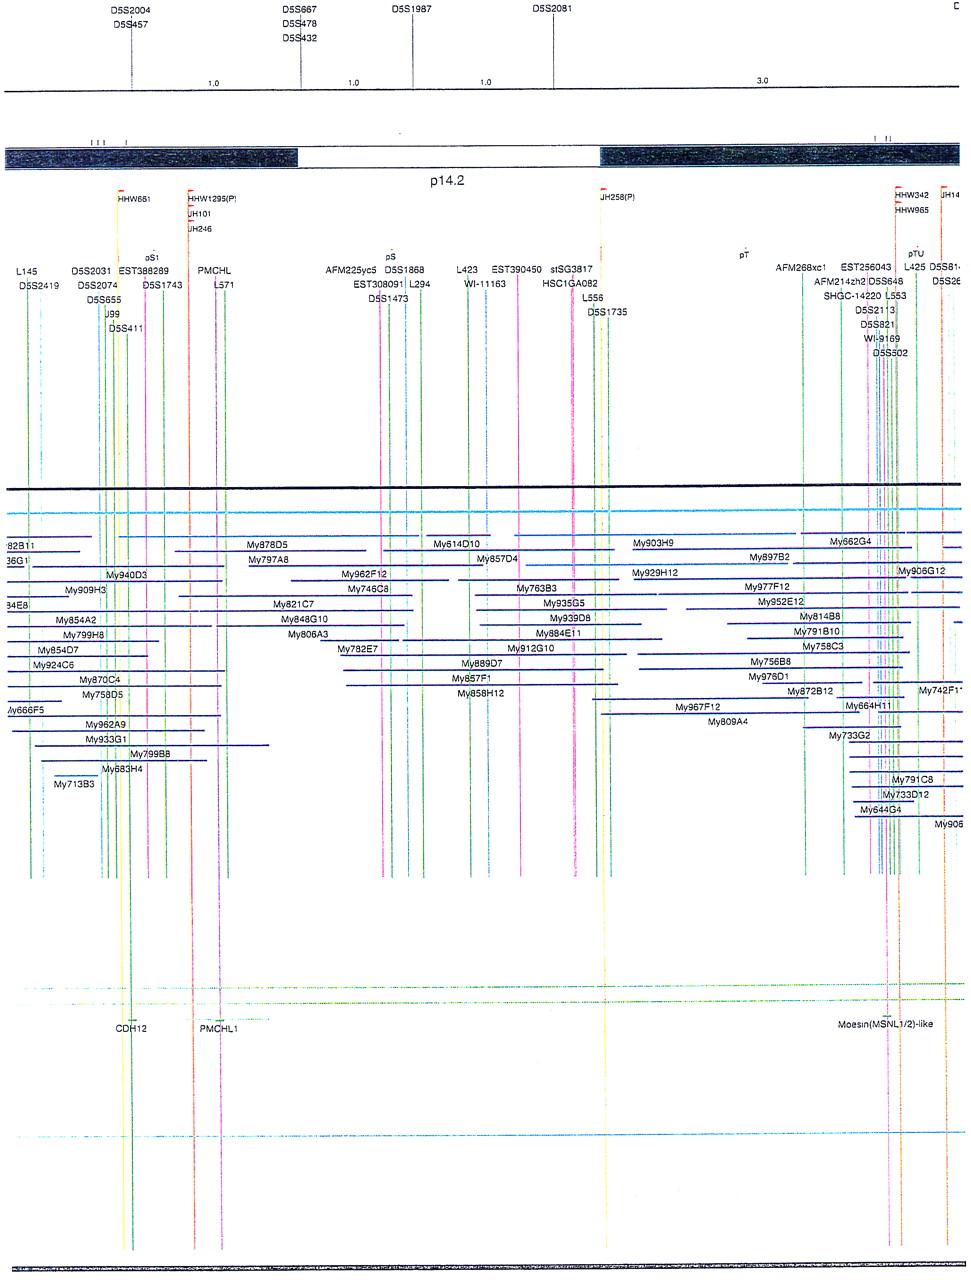
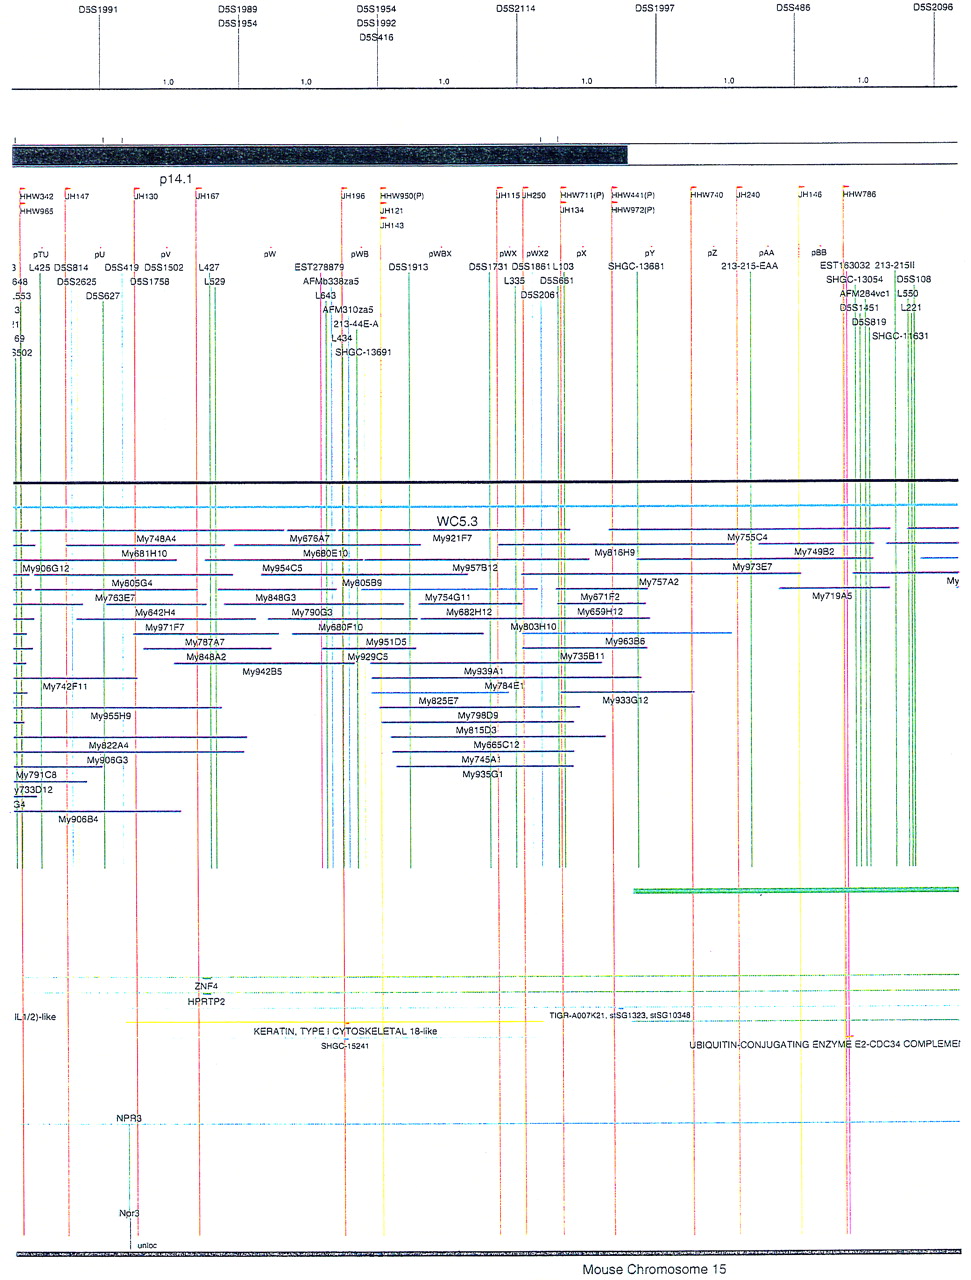
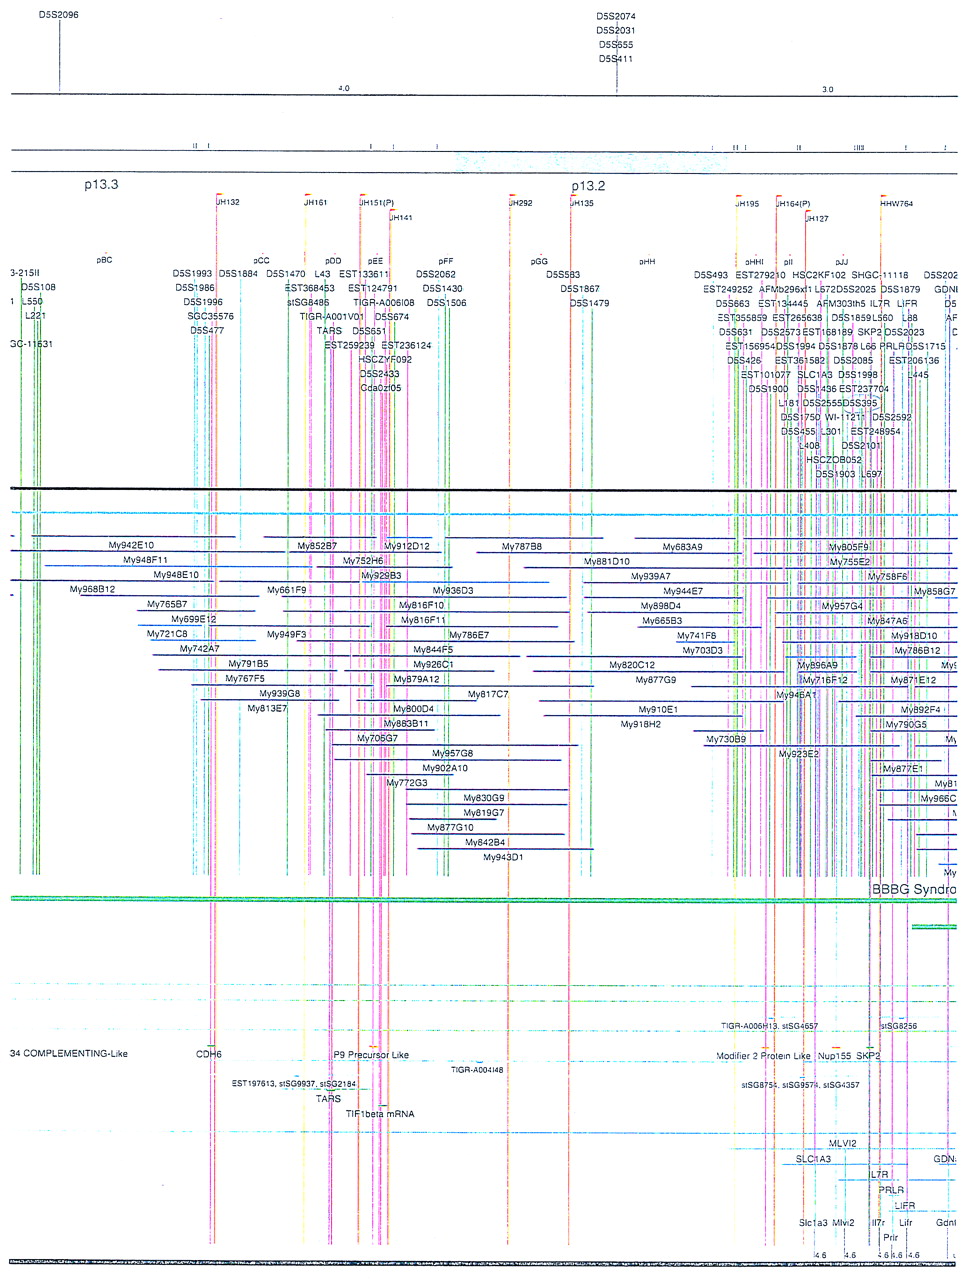
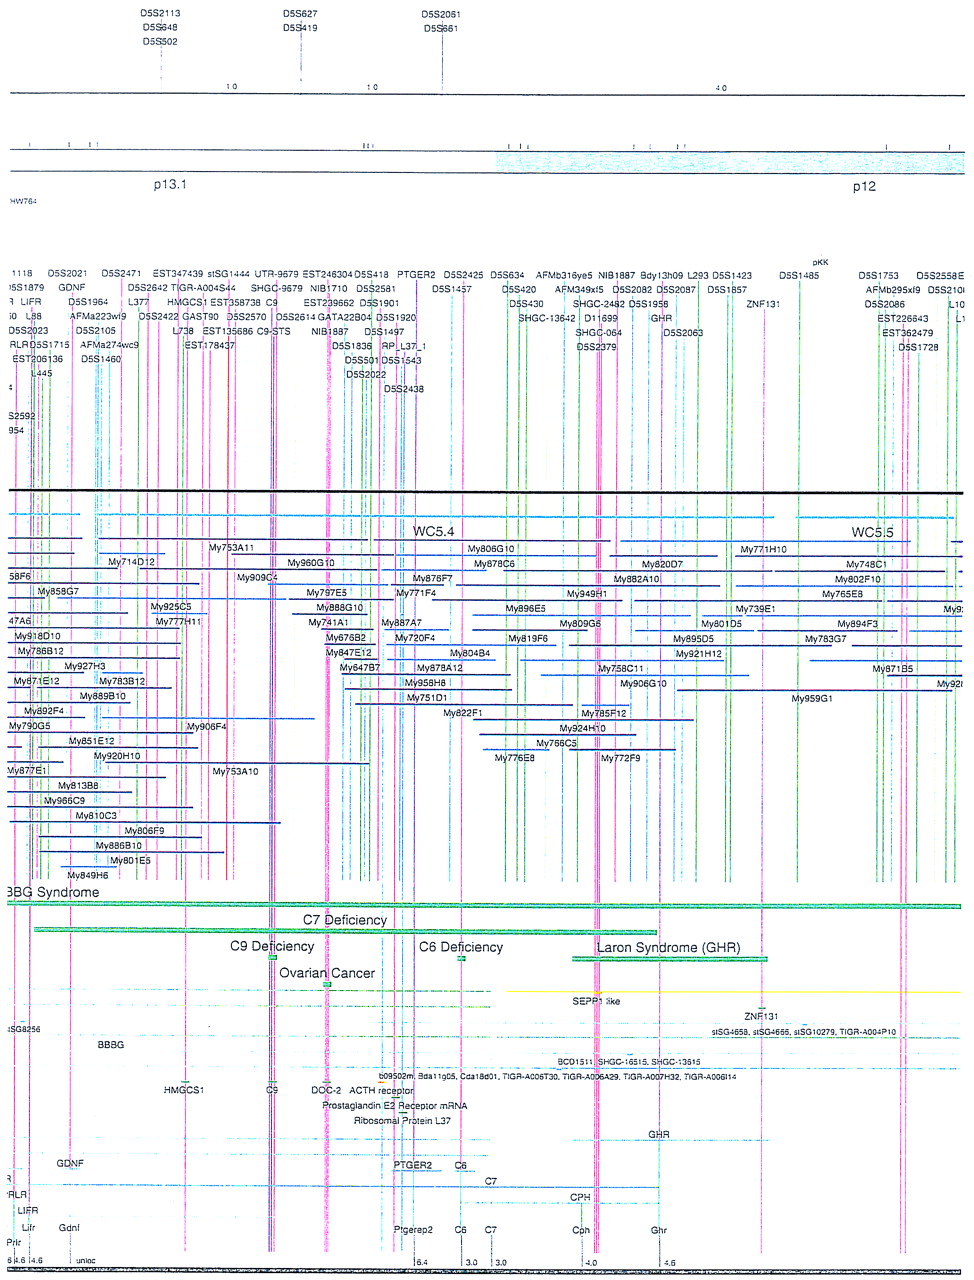
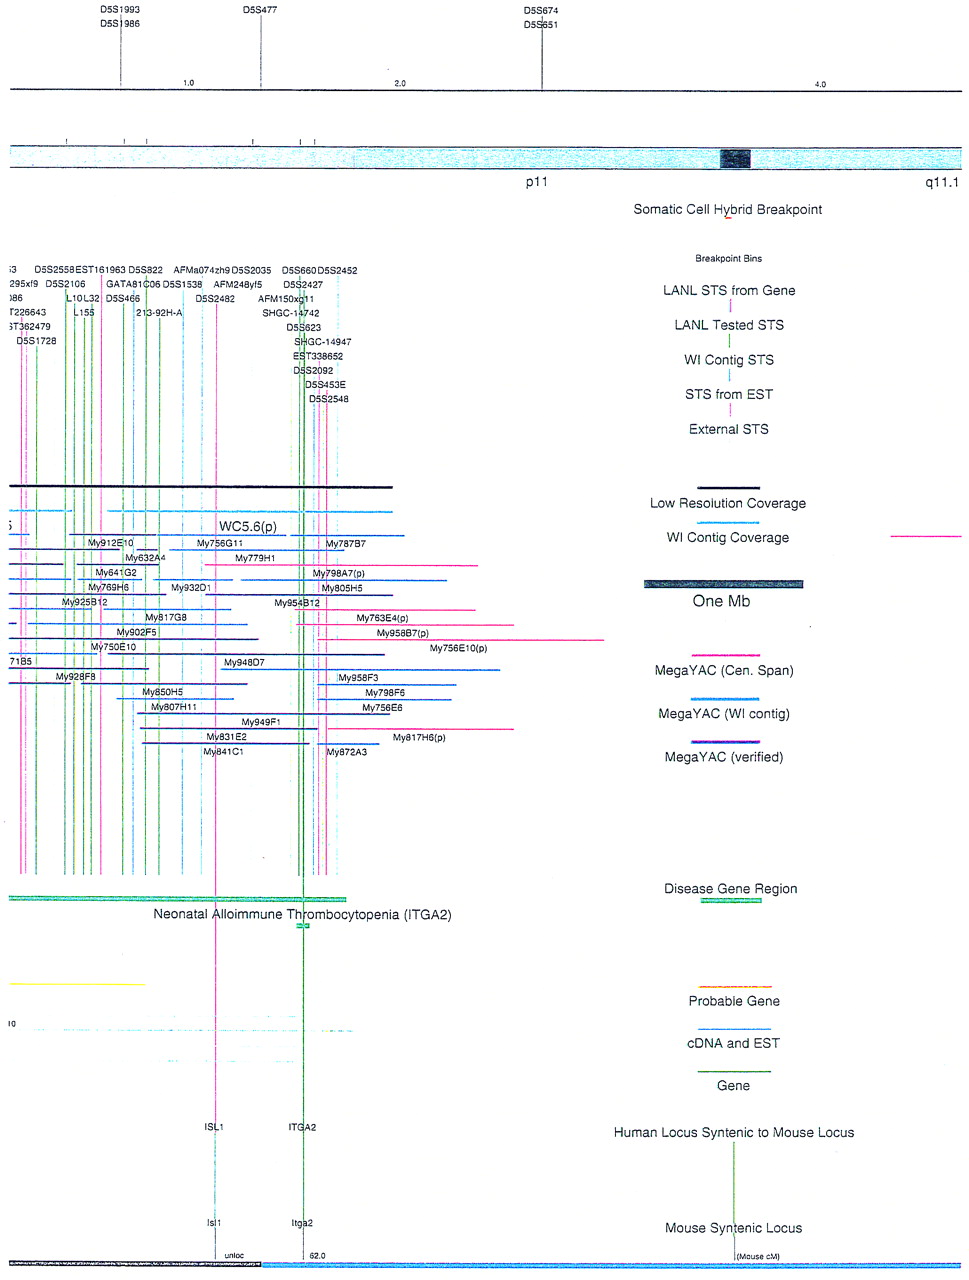
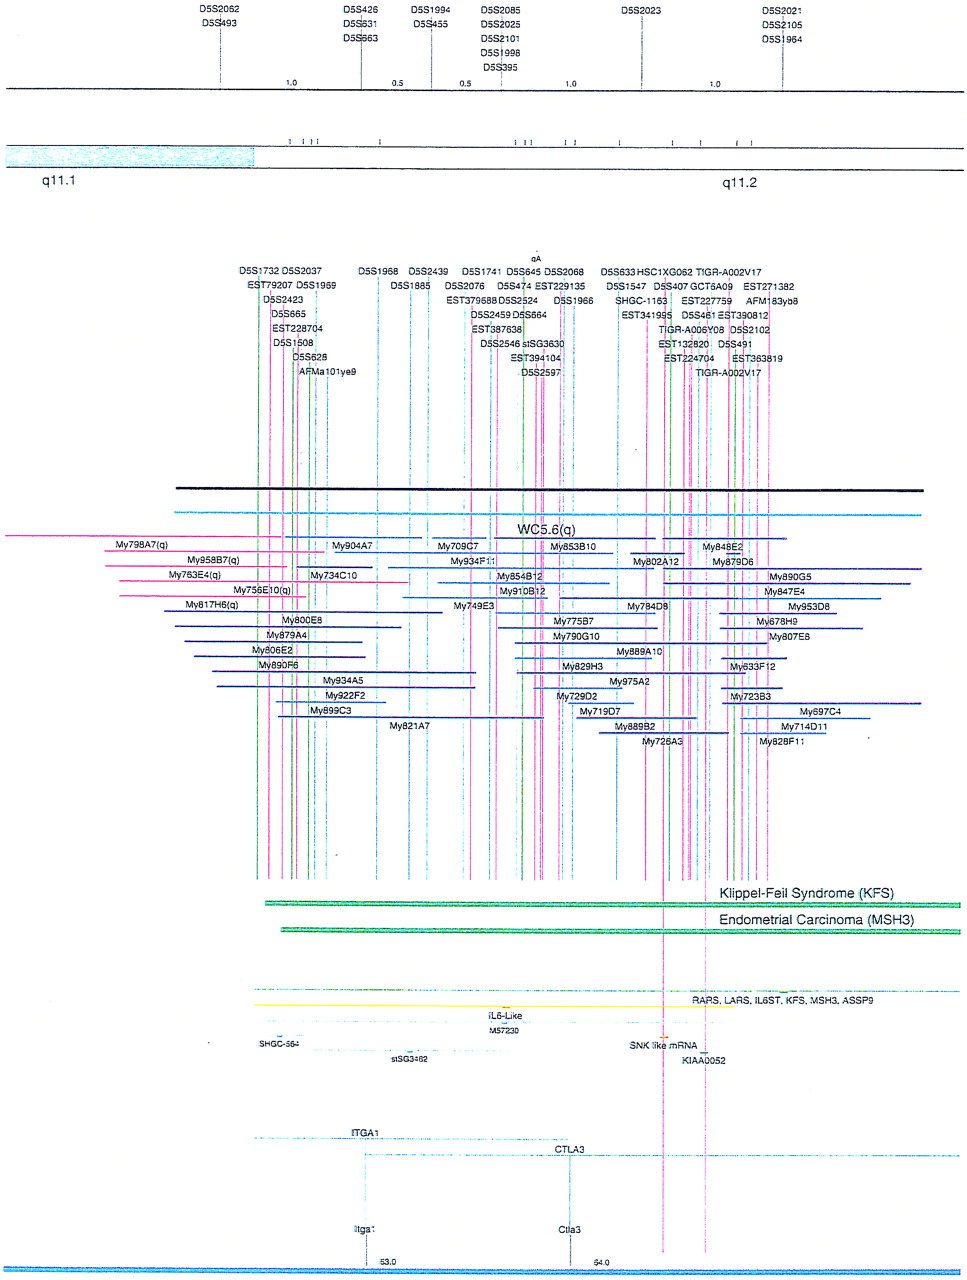
Integrated physical map of human chromosome 5p. The map is represented on 10 consecutive pages and includes all of the short arm (p) of chromosome 5, the centromeric region, and the proximal 4.5 Mb of the long arm (q). The map is arranged from top to bottomin tiers depending on the type of information that is provided. The uppermost tier represents the genetic map of human chromosome 5p, with the genetic markers (D5S no.) indicated along the map in a centimorgan (cM) scale. Lines connecting the genetic positions of the markers and physical positions indicate the correspondence between the two maps. The scale for the physical map is 3 cm = 1 Mb of DNA. The next tier depicts the ideogram of the chromosome. Below the ideogram, the somatic cell hybrid breakpoints are shown with orange vertical lines continuing through the remainder of the map and arrows to indicate the region of the chromosome represented in a given somatic cell hybrid. Breakpoints that have been anchored cytogenetically are indicated by registration lines extending upward to specific cytogenetic bands. The bin names (pA–qA) delineated by the breakpoints are shown in the next tier. The level below depicts the STSs and ESTs found on the chromosome. Registration lines for these markers are color coded to represent anonymous markers (green), ESTs (red), and genes (violet), tested in this study, and integrated STSs tested by the Whitehead Institute (blue). Below the STS tier is a black bar summarizing YAC coverage. Gaps in this bar indicate potential discontinuities in mega-YAC coverage. The turquoise bars below the low resolution coverage are an overlay of the Whitehead YAC contig coverage (Hudson et al. 1995). Beneath the Whitehead contigs are mega YACs (names beginning with My) and a few smaller YACs made by collaborating labs. The CEPH mega YACs are drawn to scale according to their size reported by CEPH or determined by our laboratory. YACs of unknown length were sized according to their STS coverage. Dark blue, light blue, and violet red are used to indicate YACs tested for this study, Whitehead contig YACs untested for this study, but integrated into the SIGMA map, and tested YACs that span the centromere, respectively. The STS content data generated here for each YAC is available from the authors. Reported disease regions and genes located through Online Mendelian Inheritance in Man (OMIM), indicated by lime green bars, are depicted in the level below the YACs. The next tier shows genes (green), psuedo or homologous genes (orange), and cDNAs (turquoise), which have been localized minimally to the cytogenetic map. The horizontal length of the line corresponds to the ambiguity of the element's location; some were localized cytogenetically whereas others were confined to YAC members containing the sequence. Registration lines from markers intersect genes in which they are contained. Those genes we localized more precisely by PCR for this study are indicated by purple registration lines. The next tier depicts those genes that have also been mapped to mouse chromosomes. The corresponding mouse syntenic loci, mouse syntenic chromosome regions, and mouse cM location are shown in the bottom tier of the integrated map.


