
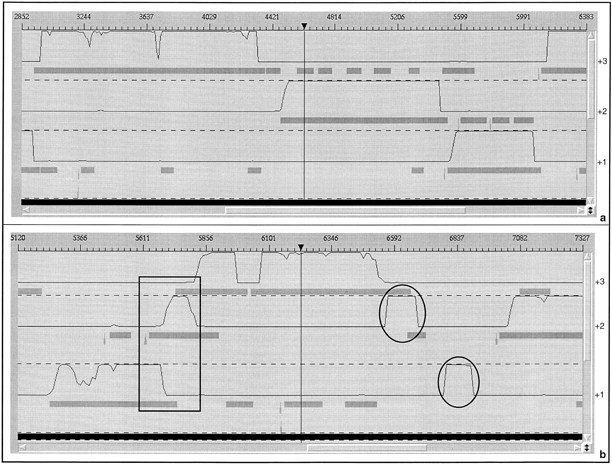
Figure 5.
Graphical maps (in the Imagene Result Manager) resulting from the analysis of two B. subtilis chromosomal regions. Results obtained with the CoDing Sequences searching method are shown in gray boxes (CDSs) and gray triangles (RBSs). Those obtained with the GeneMark coding prediction method are displayed as black continuous lines. Results are shown in the three positive frames. (a) Analysis of a fragment of the B. subtilis purine operon. (b) Analysis of a chromosome region containing sequencing errors. Atypical features in the second map are circled in black.


