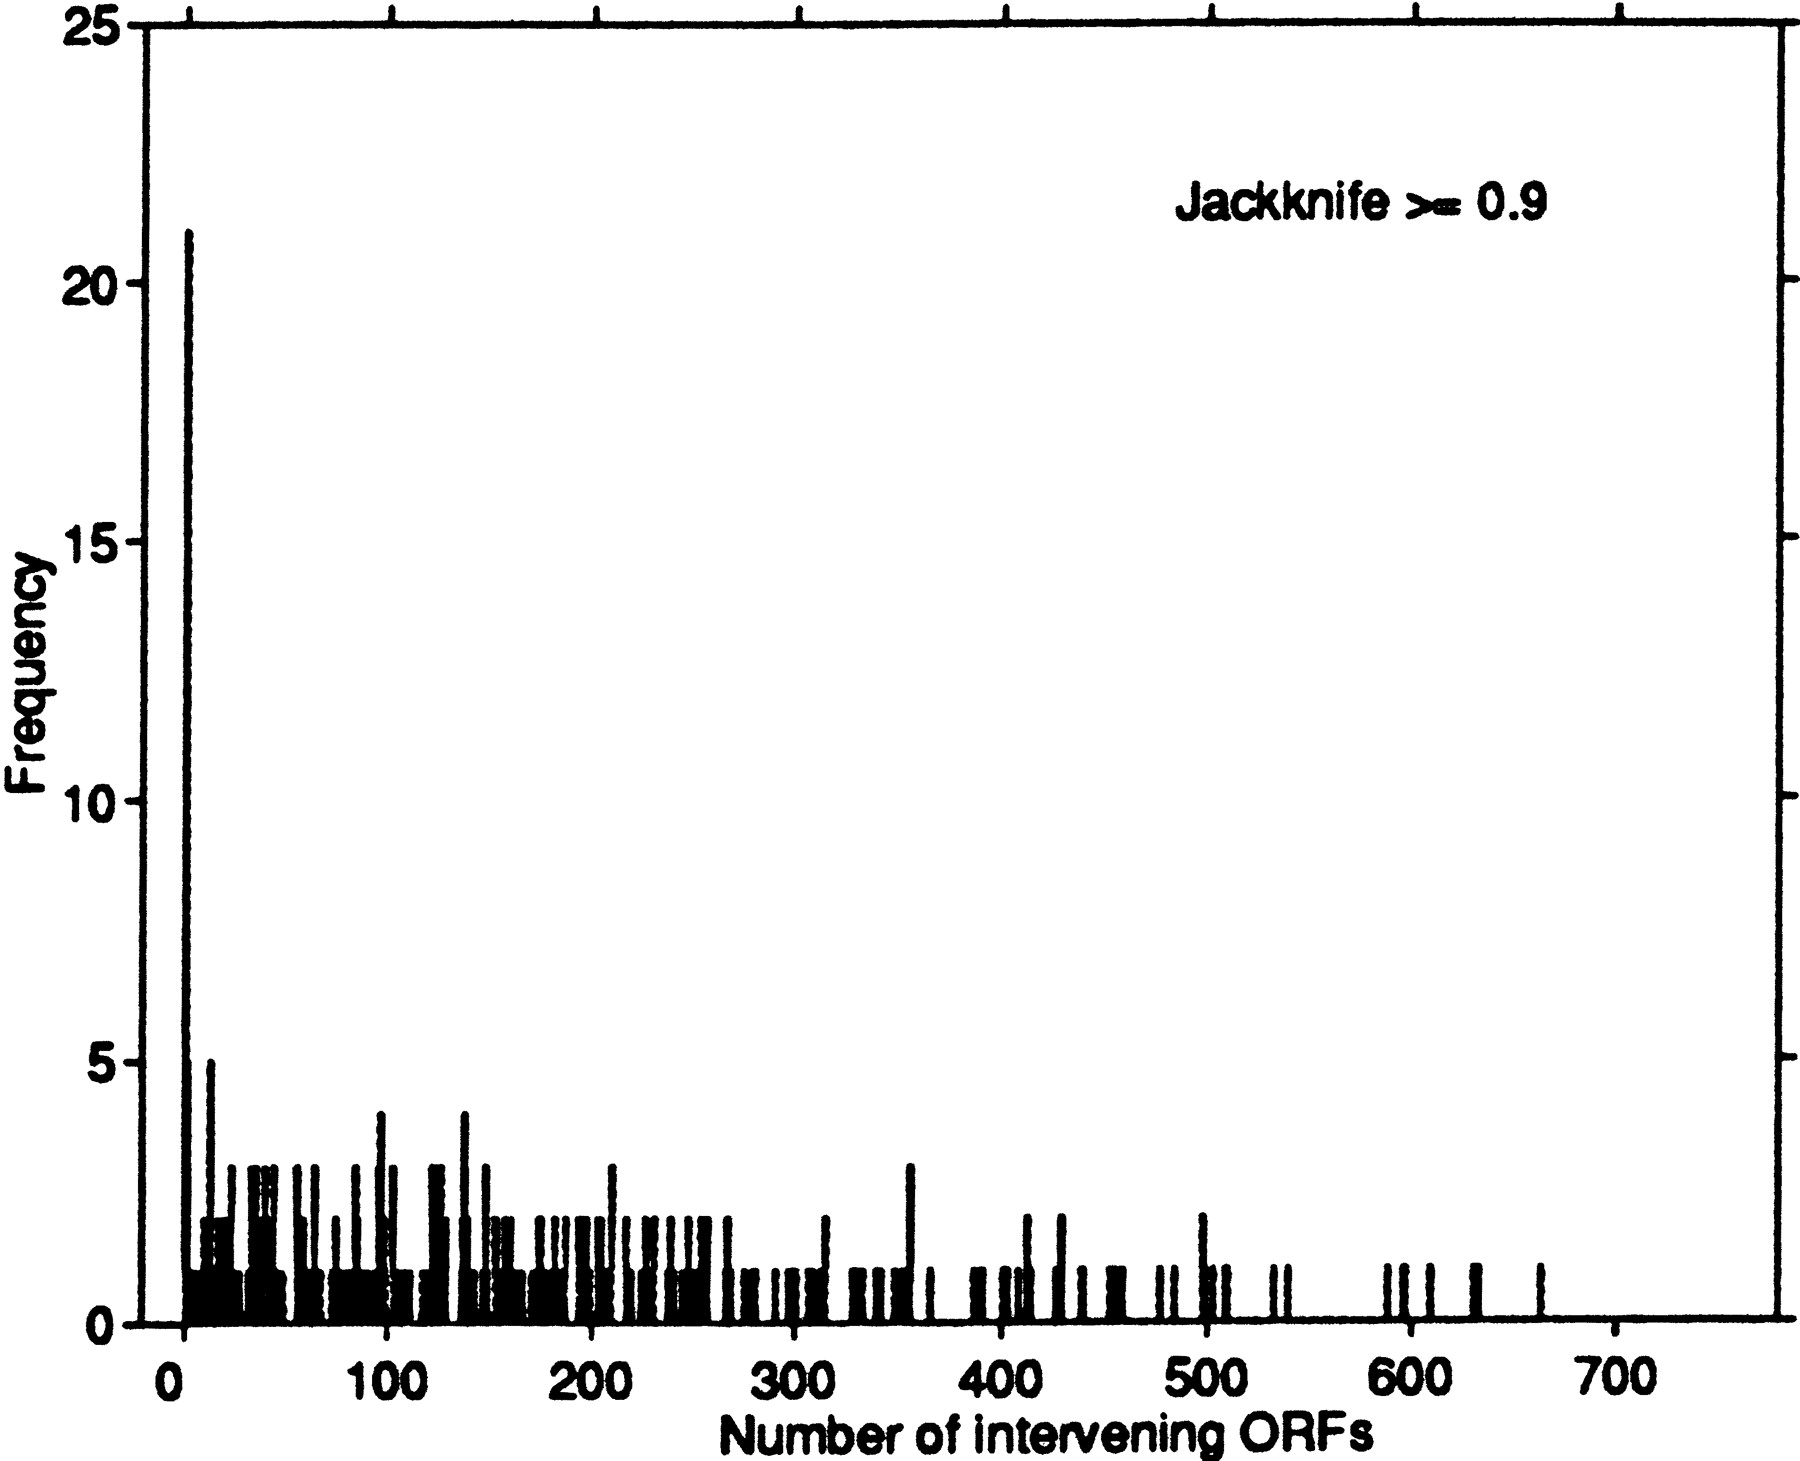
Exploring Expression Data: Identification and Analysis of Coexpressed Genes

(Downloading may take up to 30 seconds. If the slide opens in your browser, select File -> Save As to save it.)

Click on image to view larger version.

Figure 9.
Figure 9.

Histogram of the distance between ORFs with a jackknife correlation of at least 0.9. Distance is measured in terms of the number of intervening ORFs separating the members of the pair. A disproportionate number (21) are consecutive on their respective chromosomes.

This Article

  1. Genome Res. 9: 1106-1115

Preprint Server