
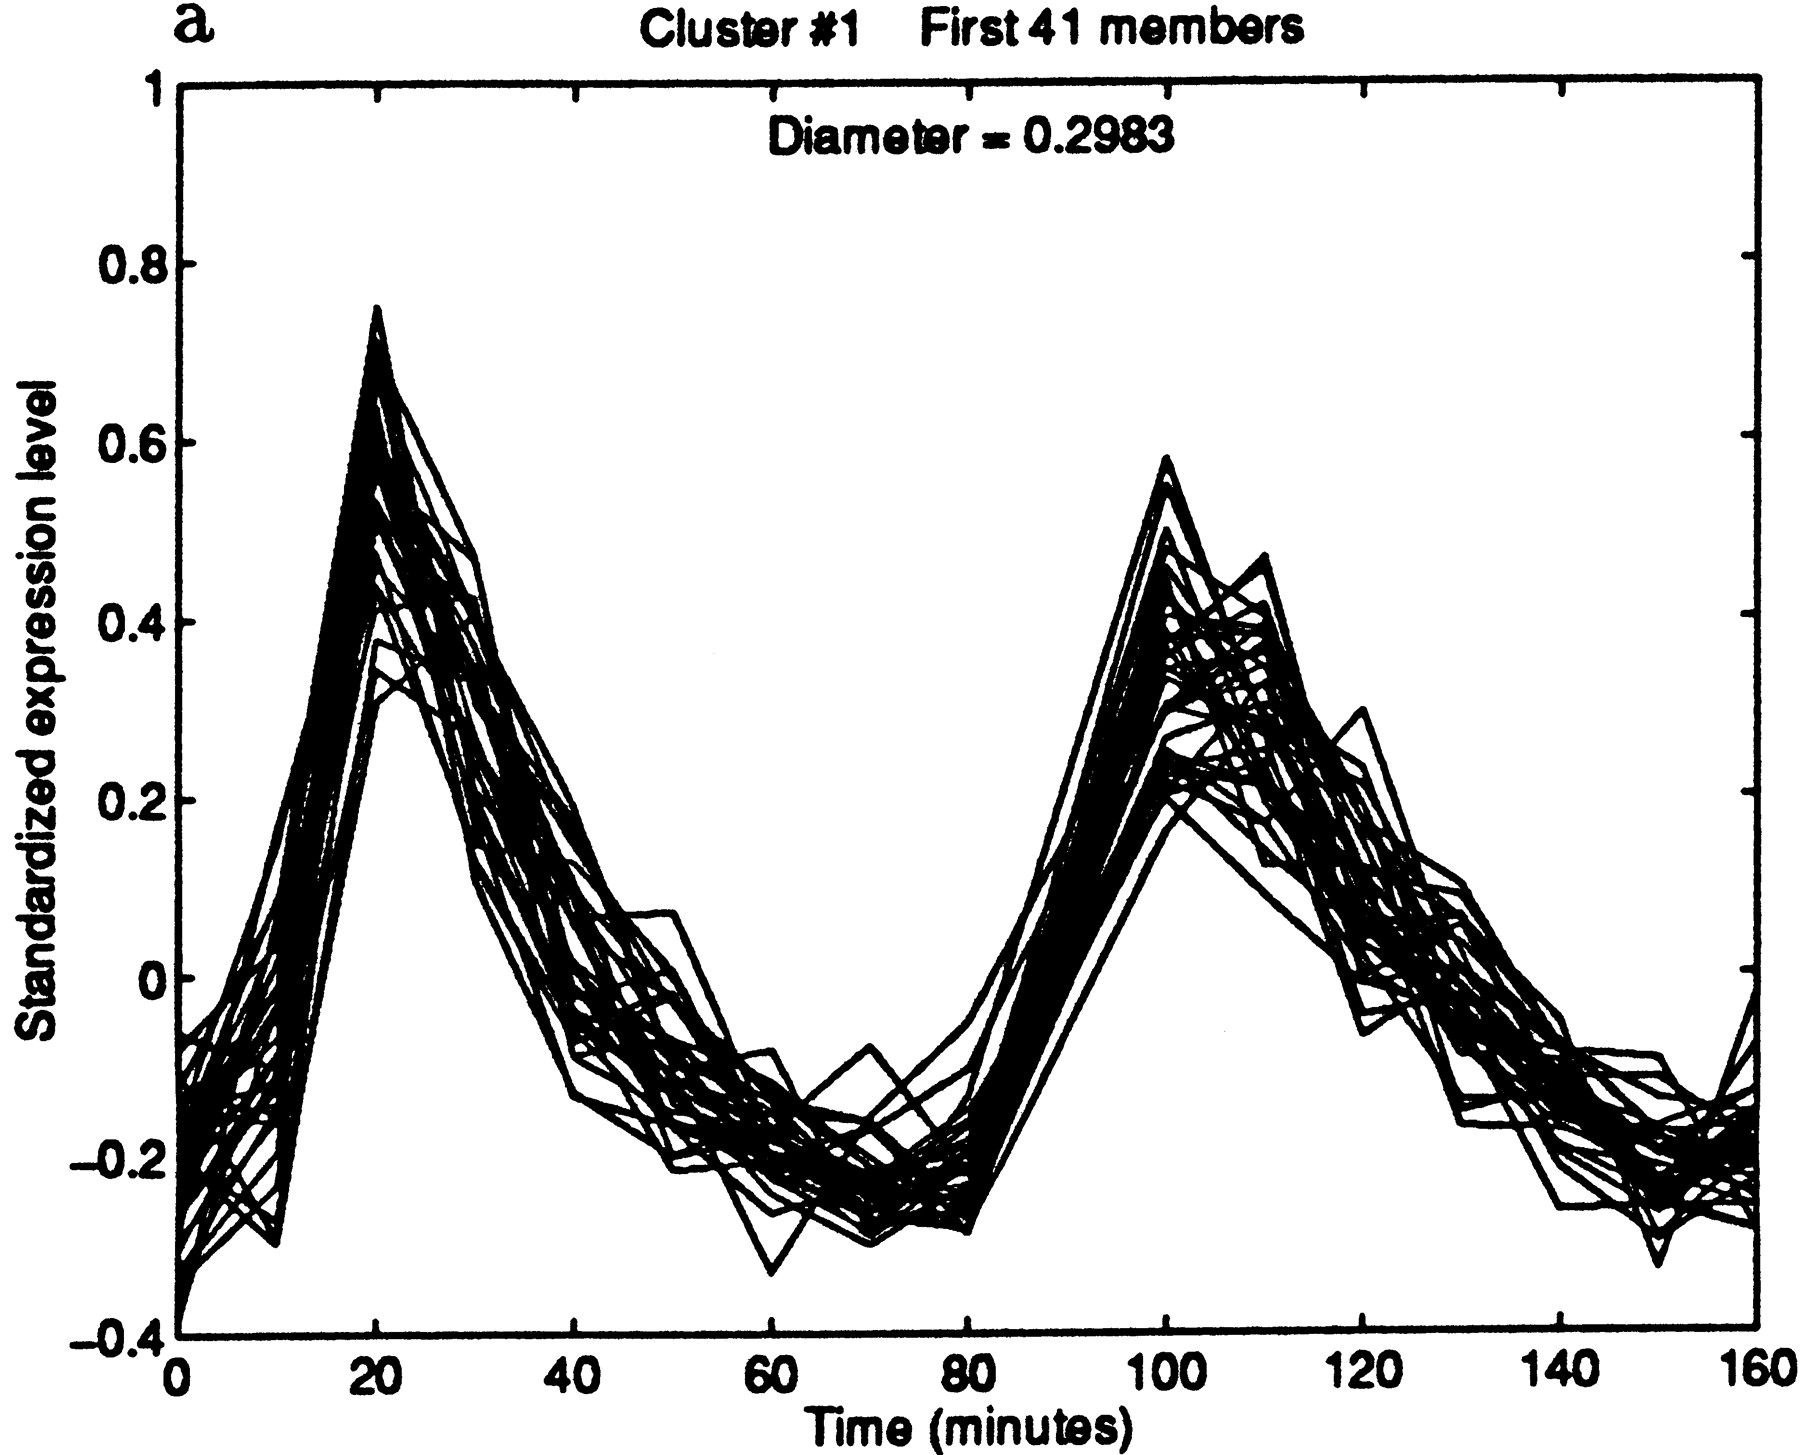
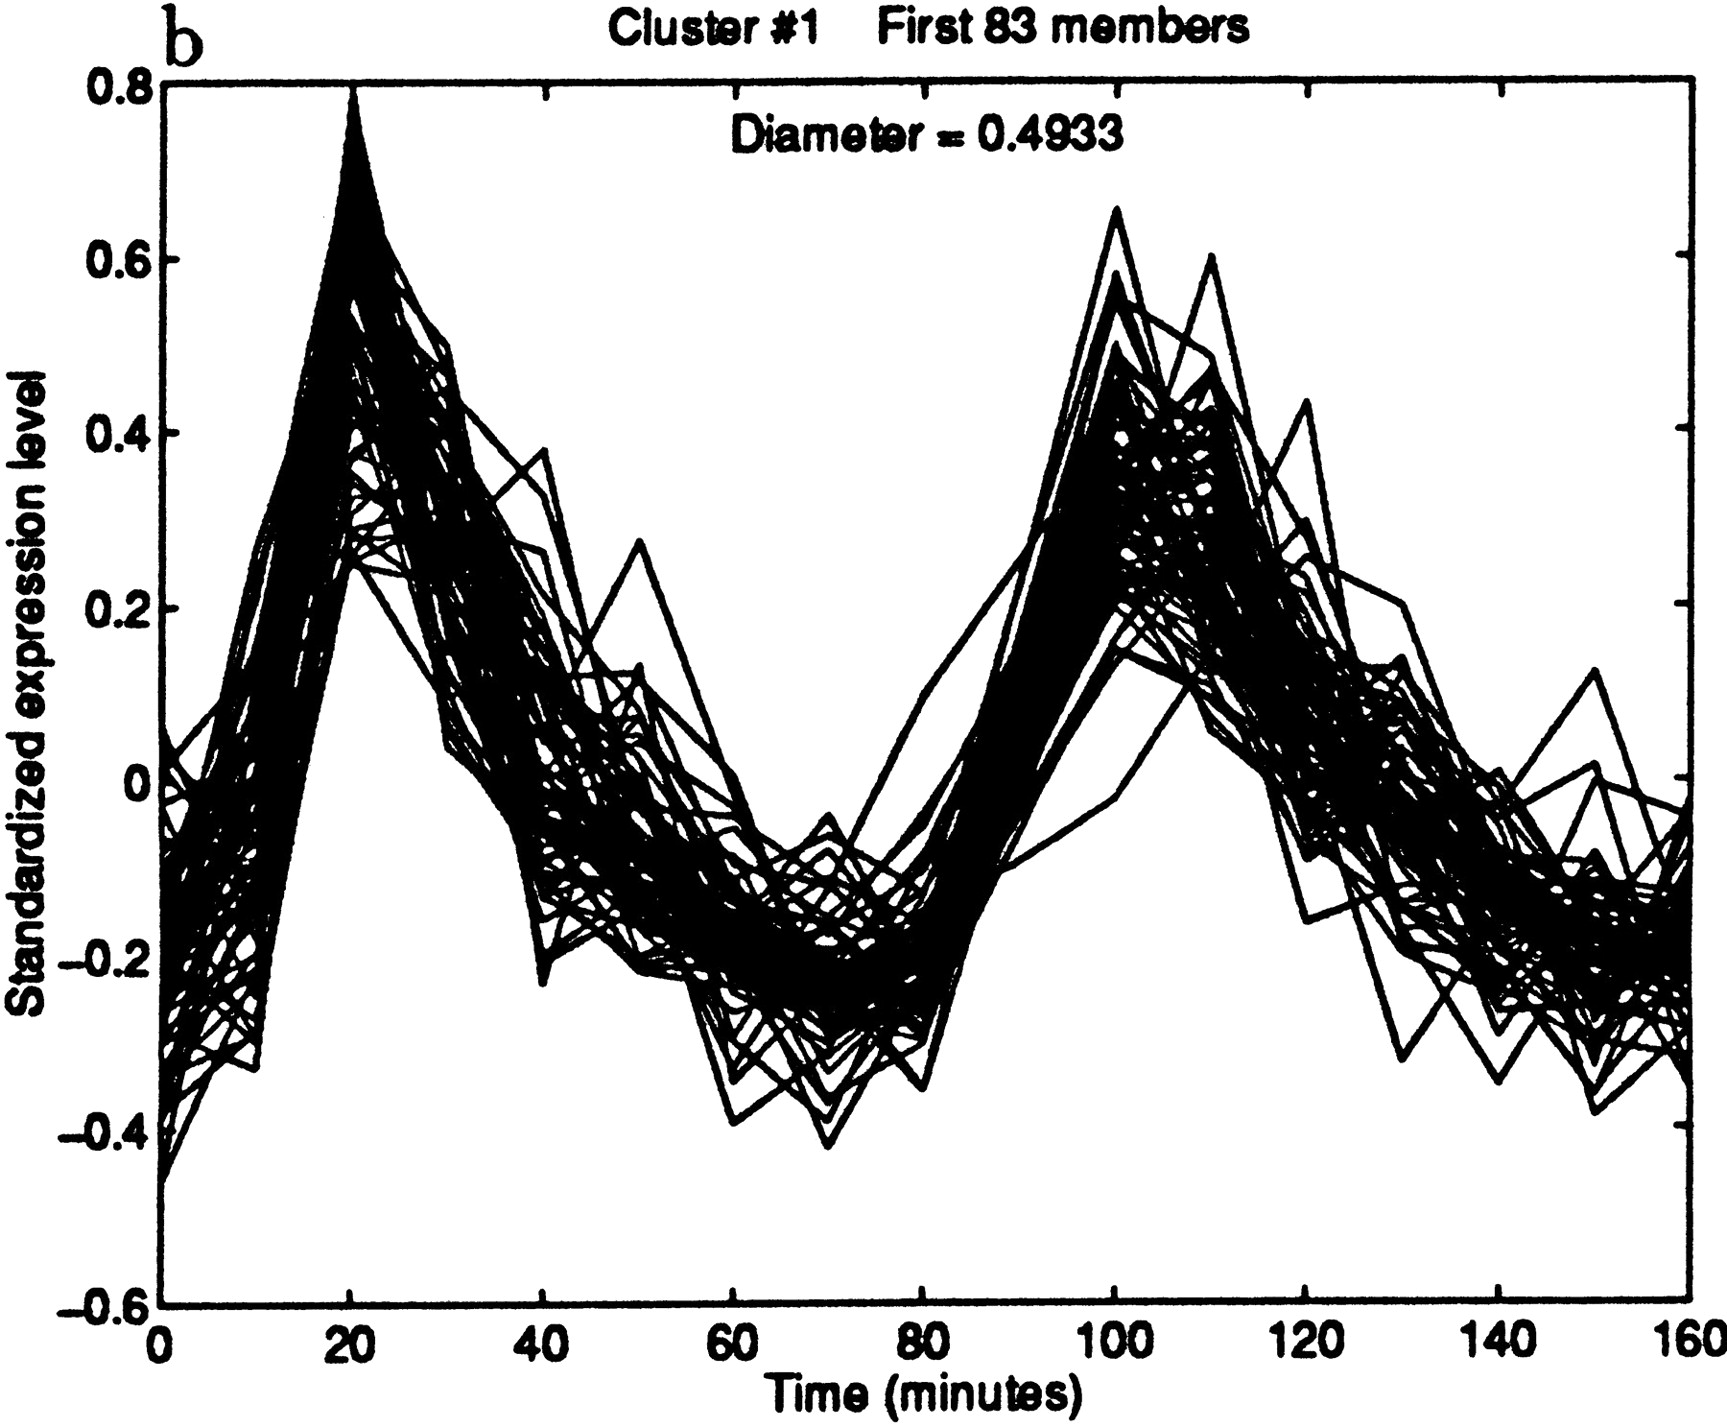
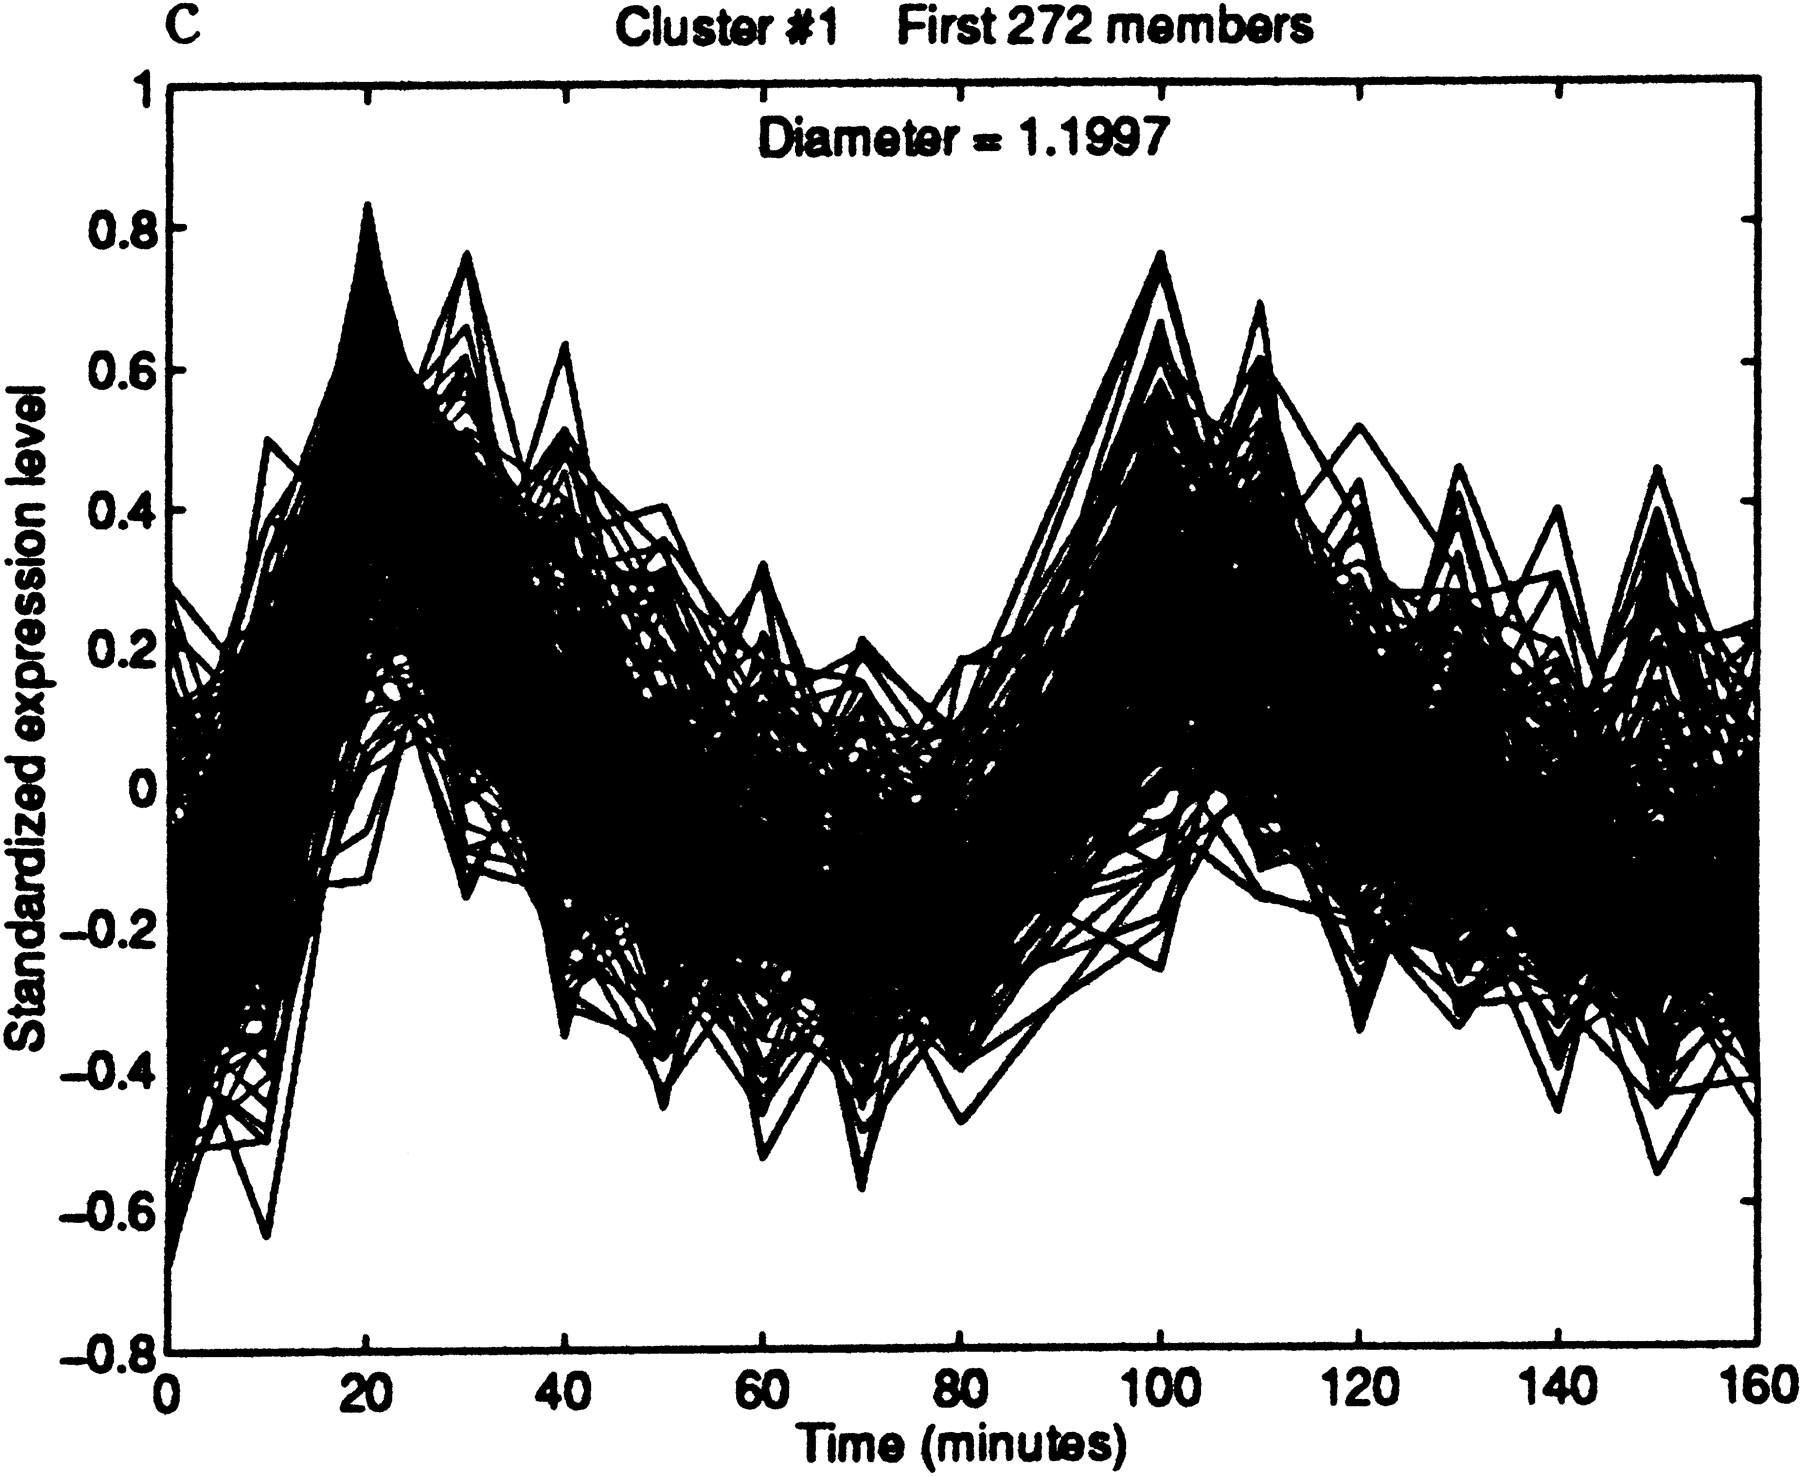
Figure 7.
Iterative building of G1 cluster. (a) Forty-one elements within a diameter threshold of 0.3. (b) Eighty-three elements within a diameter of 0.5. The cluster is beginning to contain patterns that peak in phases other than G1. (c) By increasing the diameter threshold to 1.2, the cluster grows to 272 elements, but now clearly contains poorly matching patterns.


