
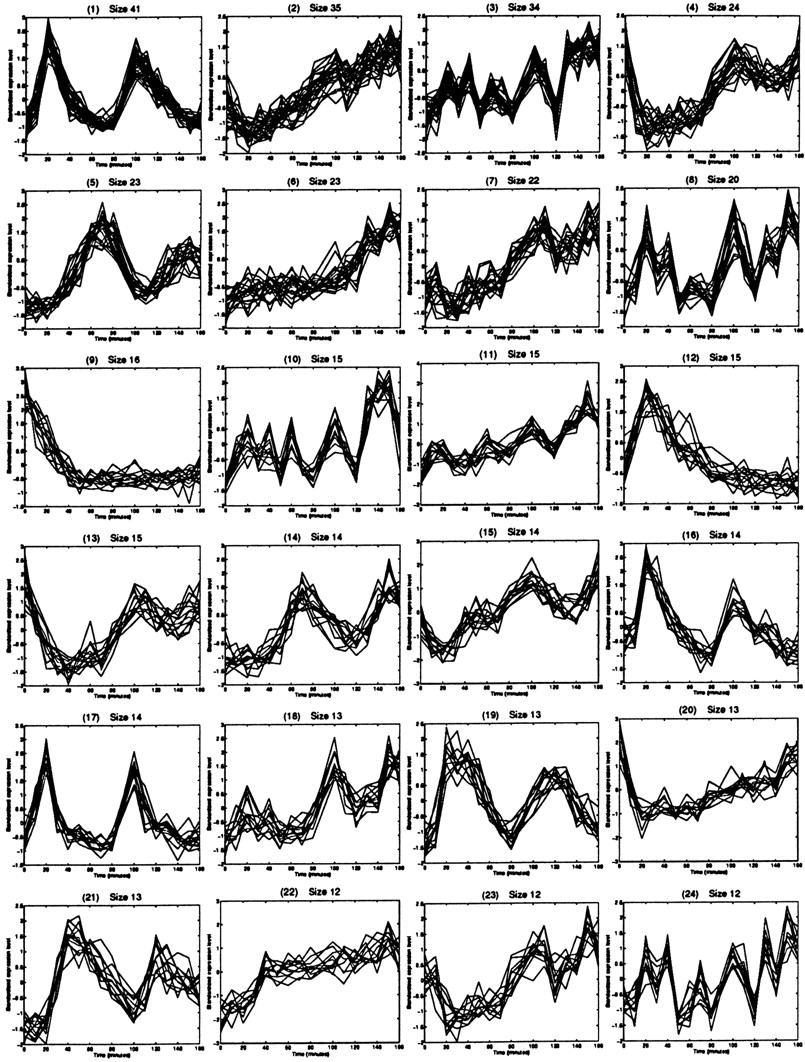
Figure 6.
The 24 largest clusters found by QT_Clust. These plots give a good overview of the types of patterns found in the data.
(Downloading may take up to 30 seconds. If the slide opens in your browser, select File -> Save As to save it.)
Click on image to view larger version.
The 24 largest clusters found by QT_Clust. These plots give a good overview of the types of patterns found in the data.
 CiteULike
 Delicious
 Digg
Digg Facebook
 Google+
 Reddit
 Twitter
