
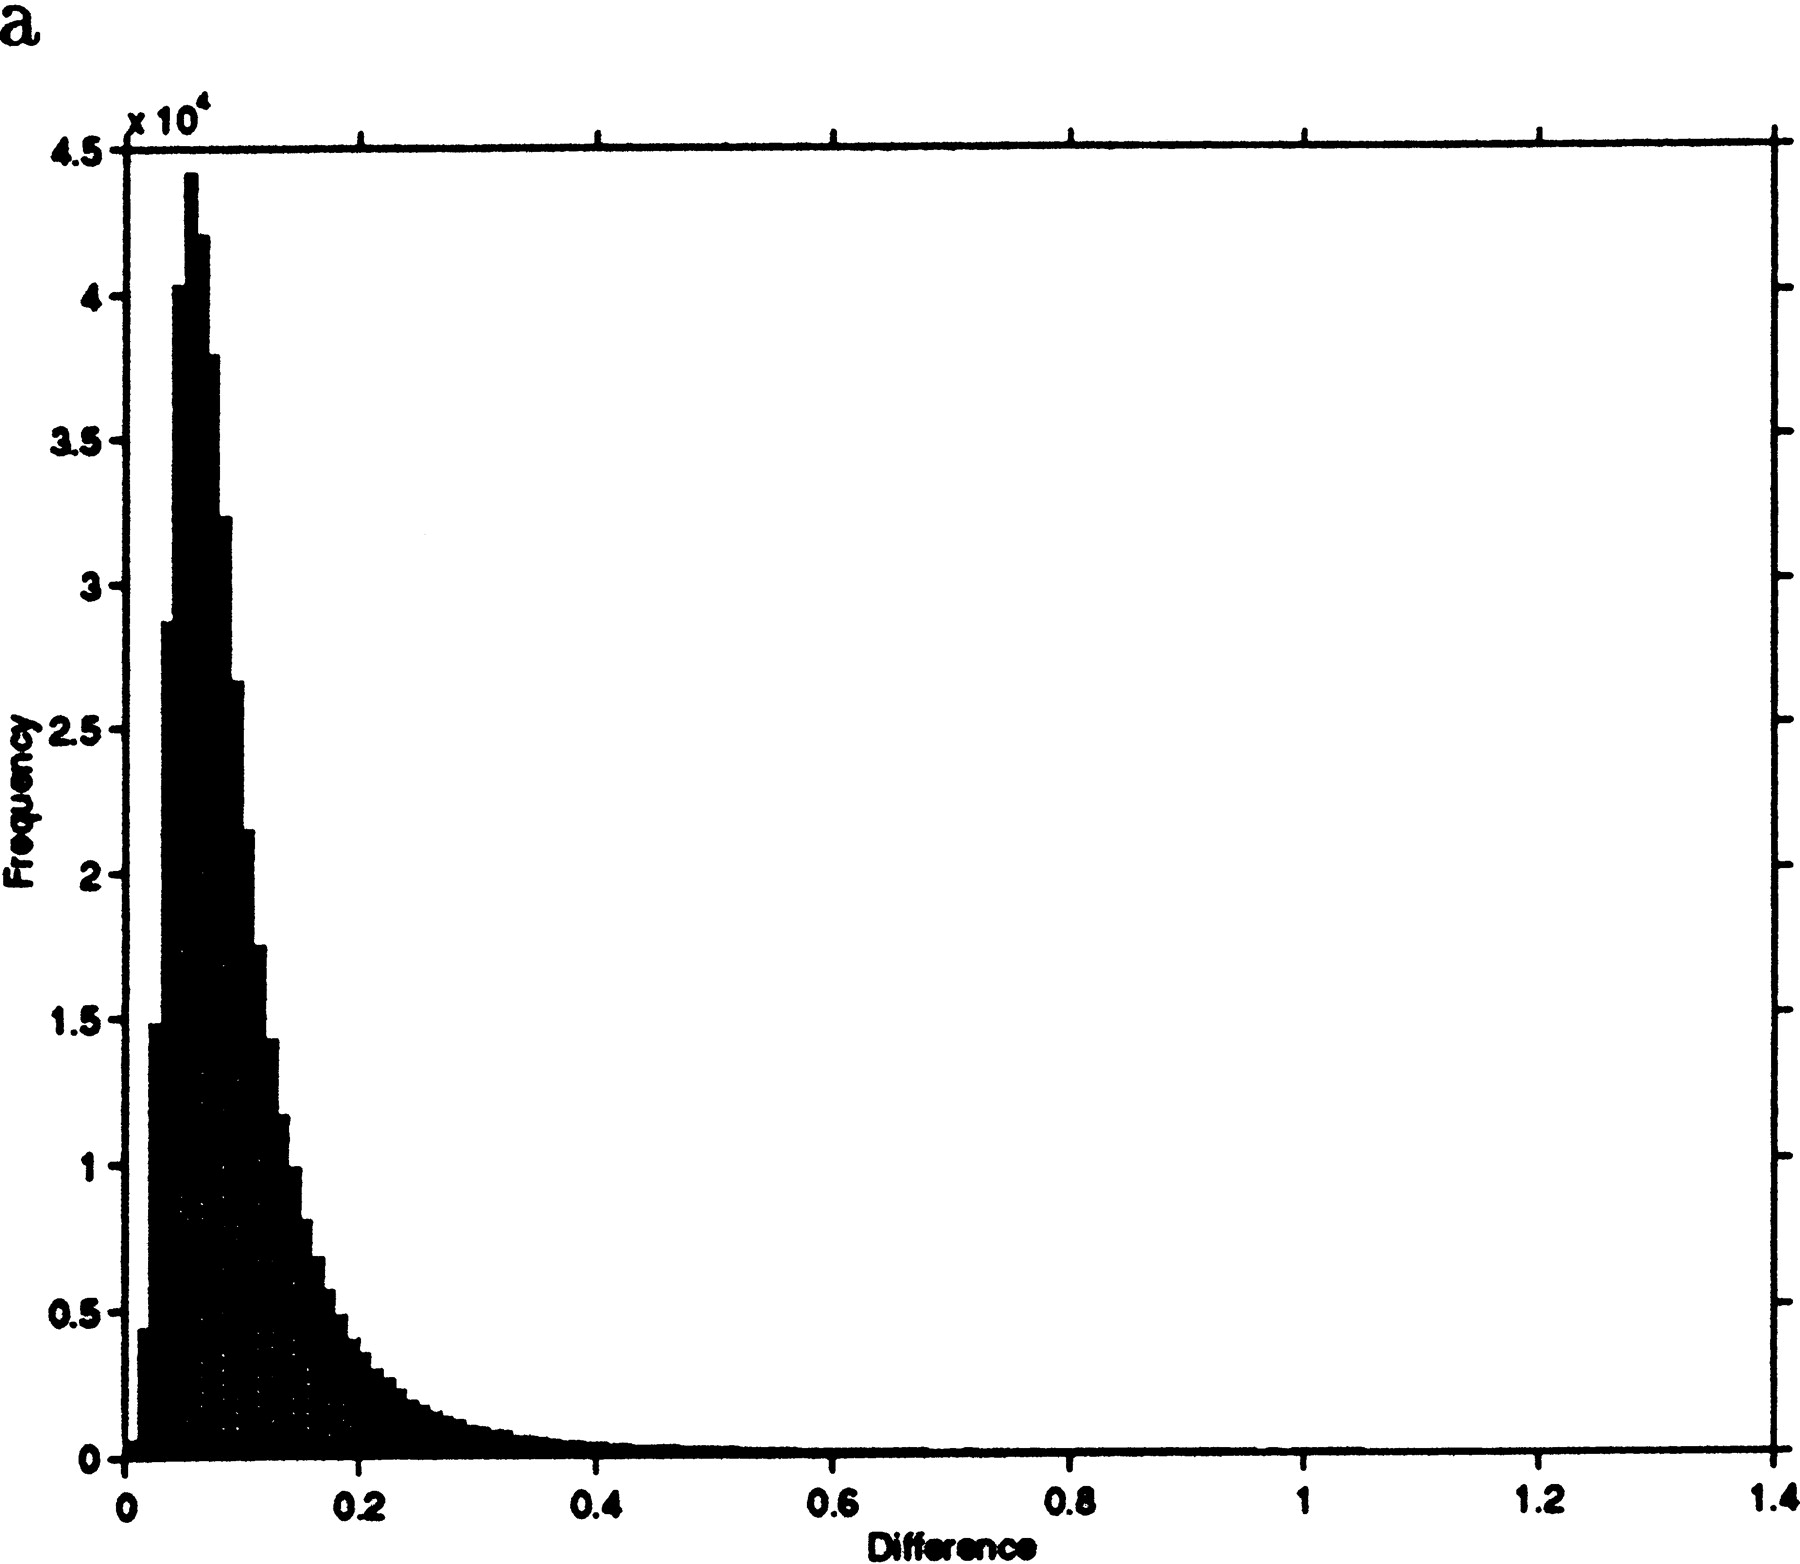
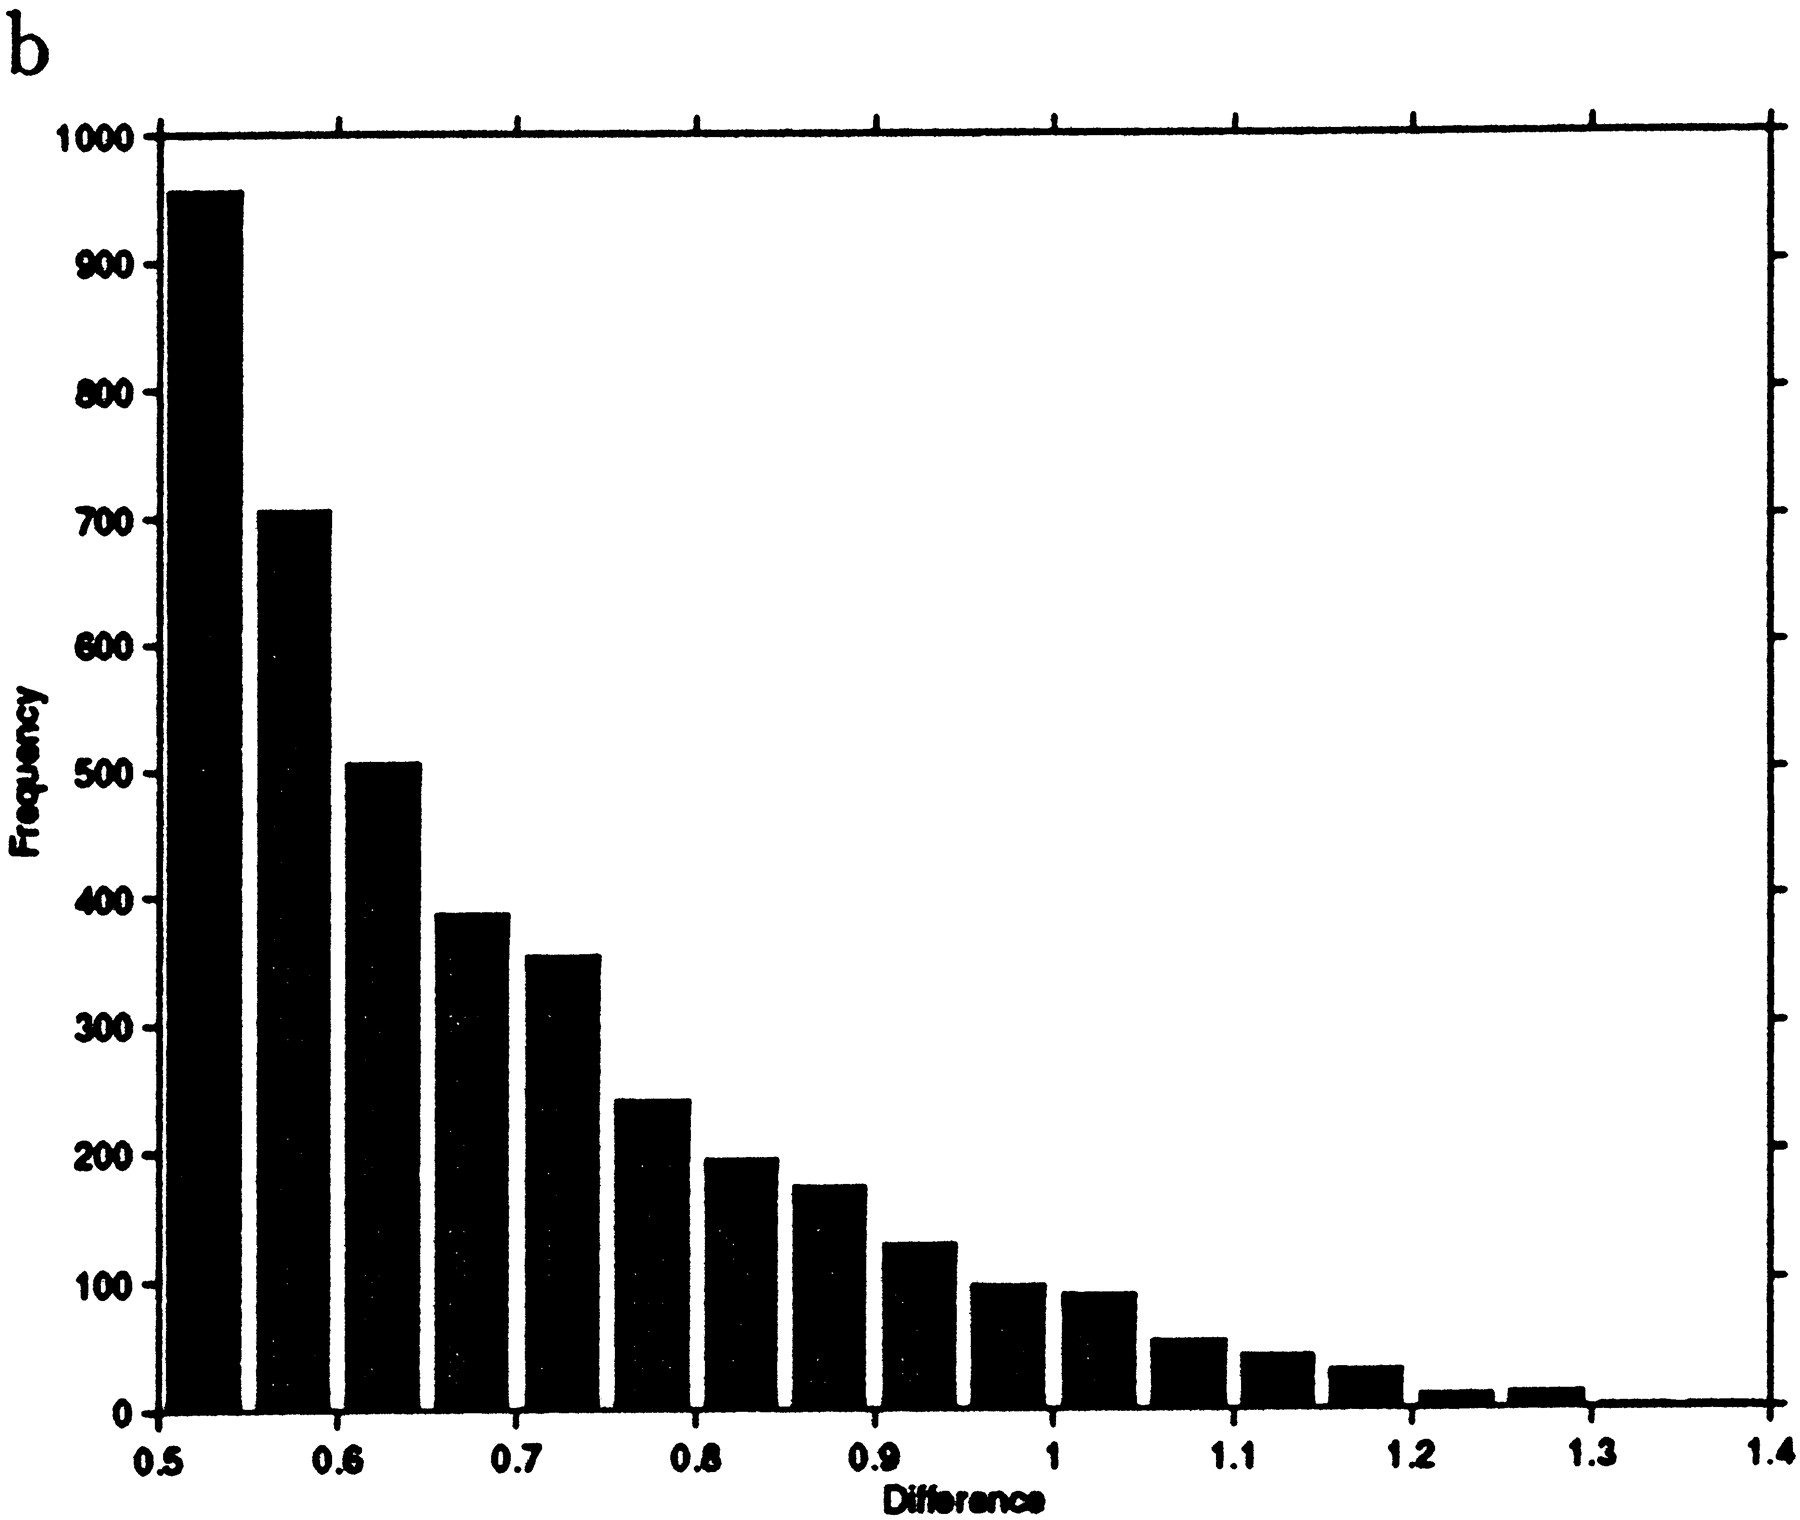
Figure 3.
(a) Frequency histogram of the difference between correlation and jackknife correlation for gene pairs whose correlation exceeds 0.6. (b) An amplification of the tail of the histogram shown ina.


