
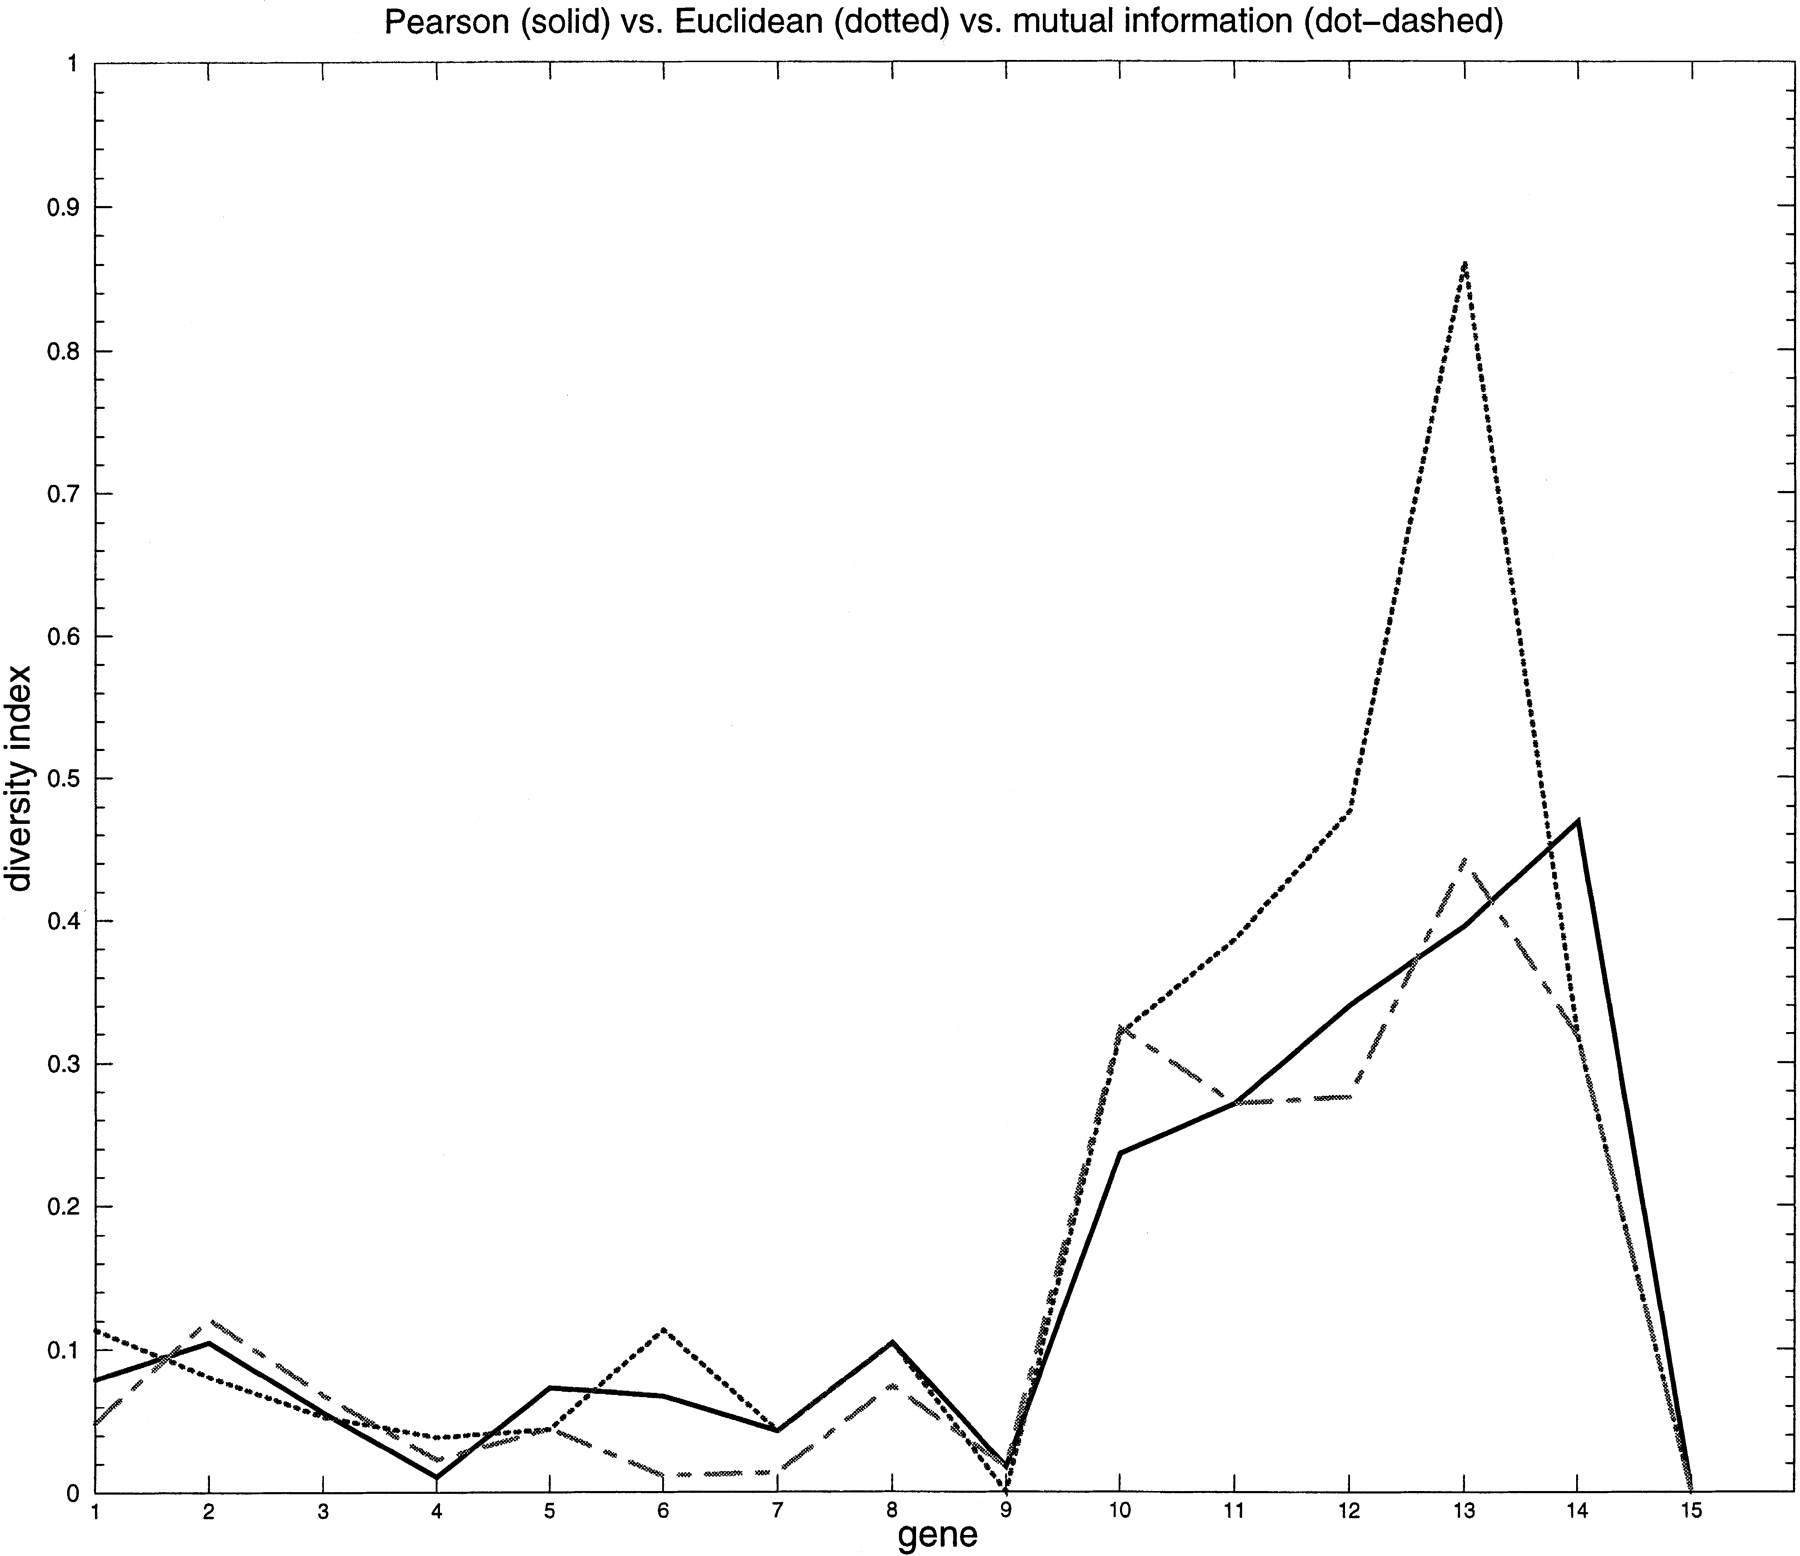
Figure 3.
Comparison of similarity measures. Diversity indices describing the cluster splitting of 15 control genes when using Euclidean distance (dotted line), Pearson correlation (solid line), and mutual information (dot-dashed line) as pairwise similarity measures. x-Axis shows the number of the respective gene; y-axis shows the diversity. Diversity is 0 if all copies are clustered in the same cluster; it is 1 if all copies are split into different clusters.


