
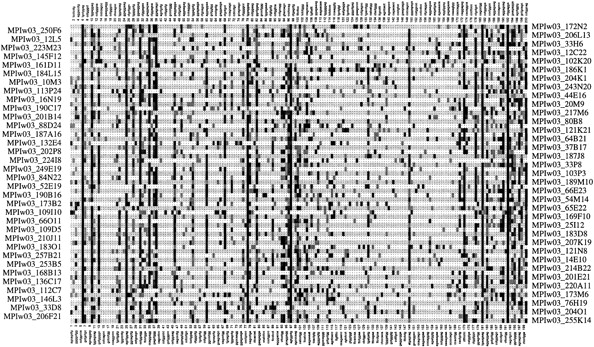
Figure 2.
Visualization of calculated cluster. A calculated cluster of size 69 that contains 63 clones from the gene Elongation factor β. Rows (left and right) correspond to clone names (internal abbreviations), and columns (top and bottom) refer to the hybridized probes. Different gray levels are introduced according to the strength of the individual hybridization signal (black = strong signal).


