
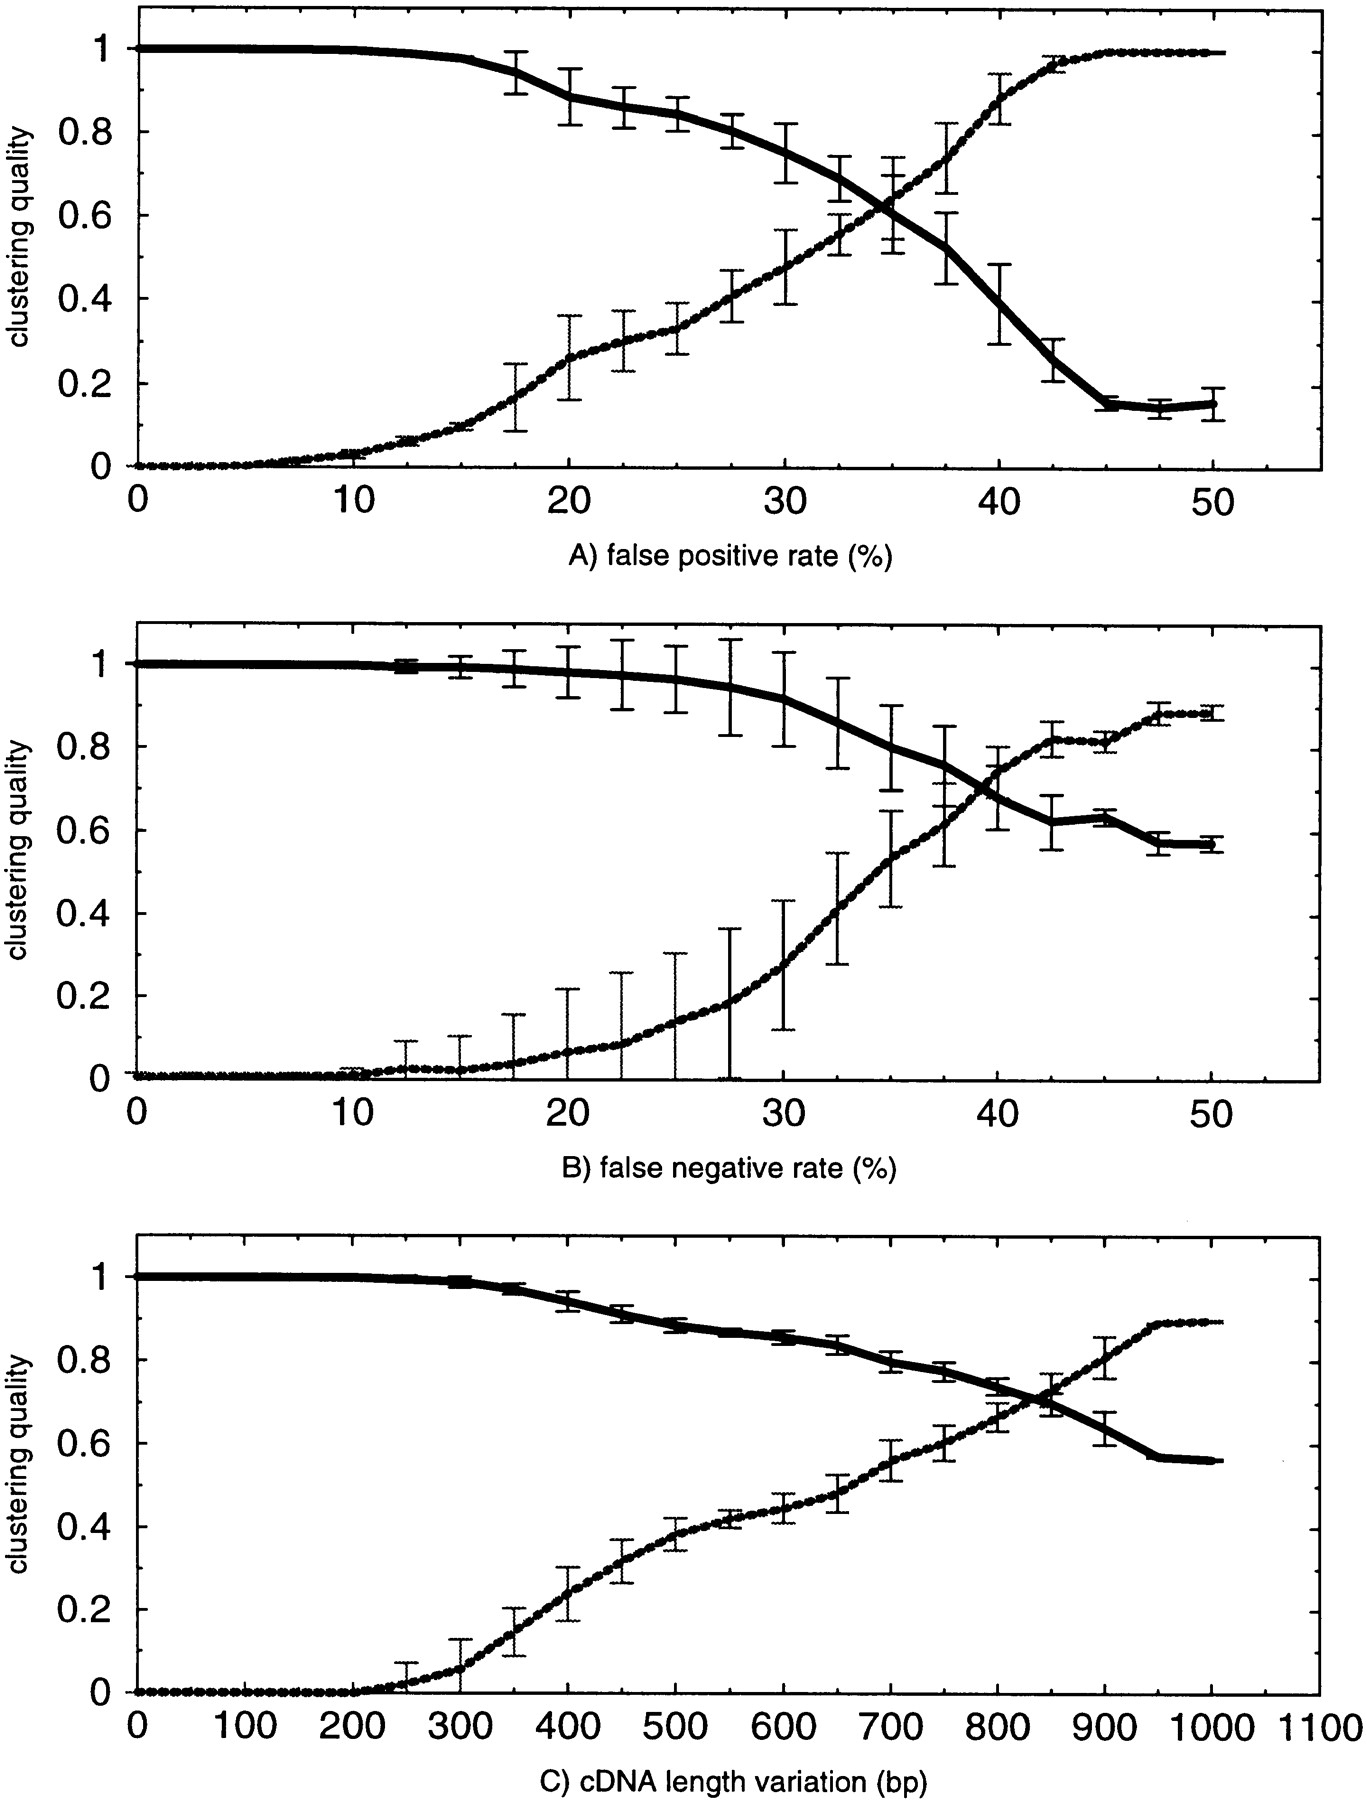
Simulation studies. Clustering is tested on three error parameters: (A) false-positive rate, (B) false-negative rate, and (C) cDNA length variation. False-positive rate and false-negative rate are measured in percents, and length variation is measured in base pairs. Clustering quality is calculated according to two different quality measures: (Broken lines) The relative Minkowsky metric, which is low if clustering quality is good and high if clustering quality is bad; (solid lines) the RMIC, which is high if clustering quality is good and low if clustering quality is bad. For each parameter size, 20 independent clusterings are performed to derive the mean (μ) and the s.d. (ς). The bars indicate the interval [μ − ς, μ + ς].


