
Figure 1.
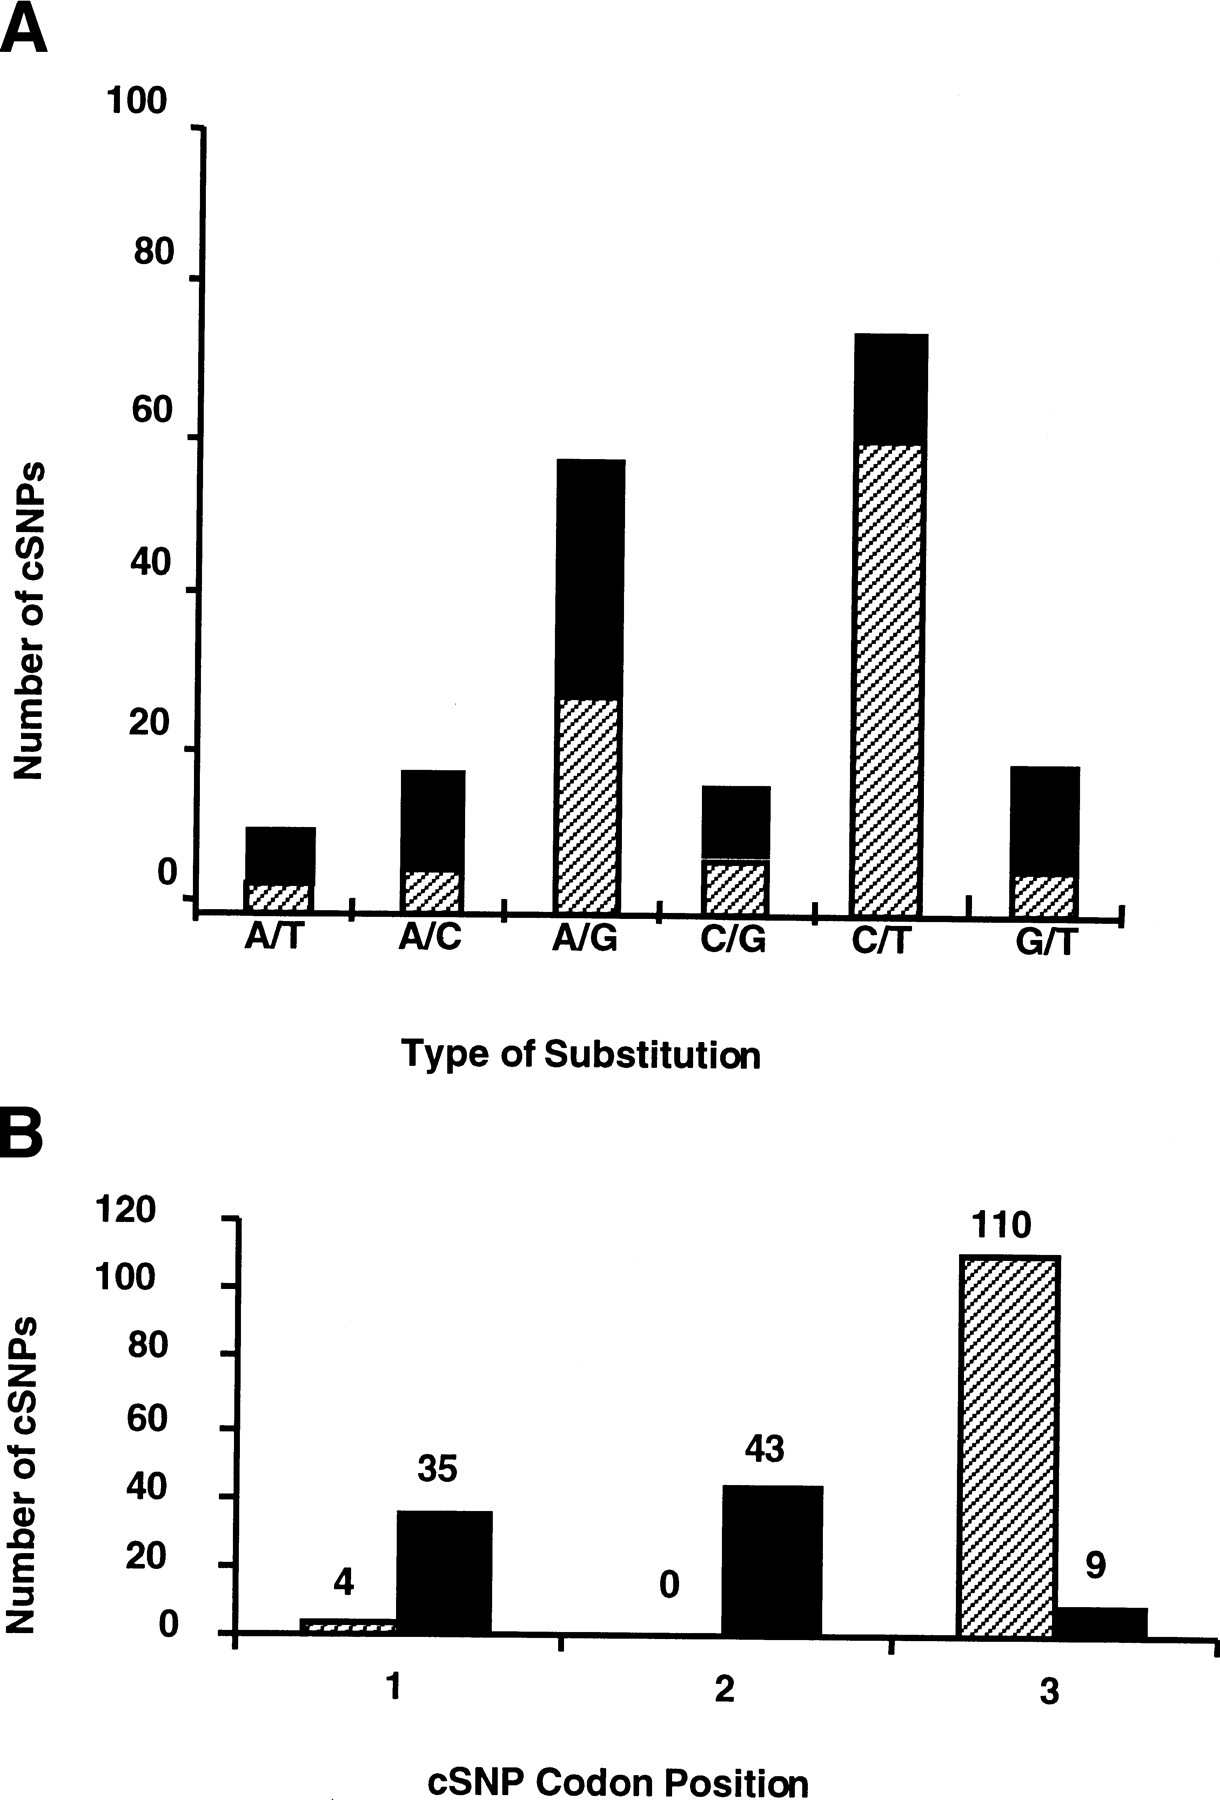
Distribution of candidate cSNPs by type of nucleotide substitution (A) and codon position (B), for synonymous (hatched bars) and nonsynonymous (solid bars) amino acid substitutions.
(Downloading may take up to 30 seconds. If the slide opens in your browser, select File -> Save As to save it.)
Click on image to view larger version.
Distribution of candidate cSNPs by type of nucleotide substitution (A) and codon position (B), for synonymous (hatched bars) and nonsynonymous (solid bars) amino acid substitutions.
 CiteULike
 Delicious
 Digg
Digg Facebook
 Google+
 Reddit
 Twitter
