

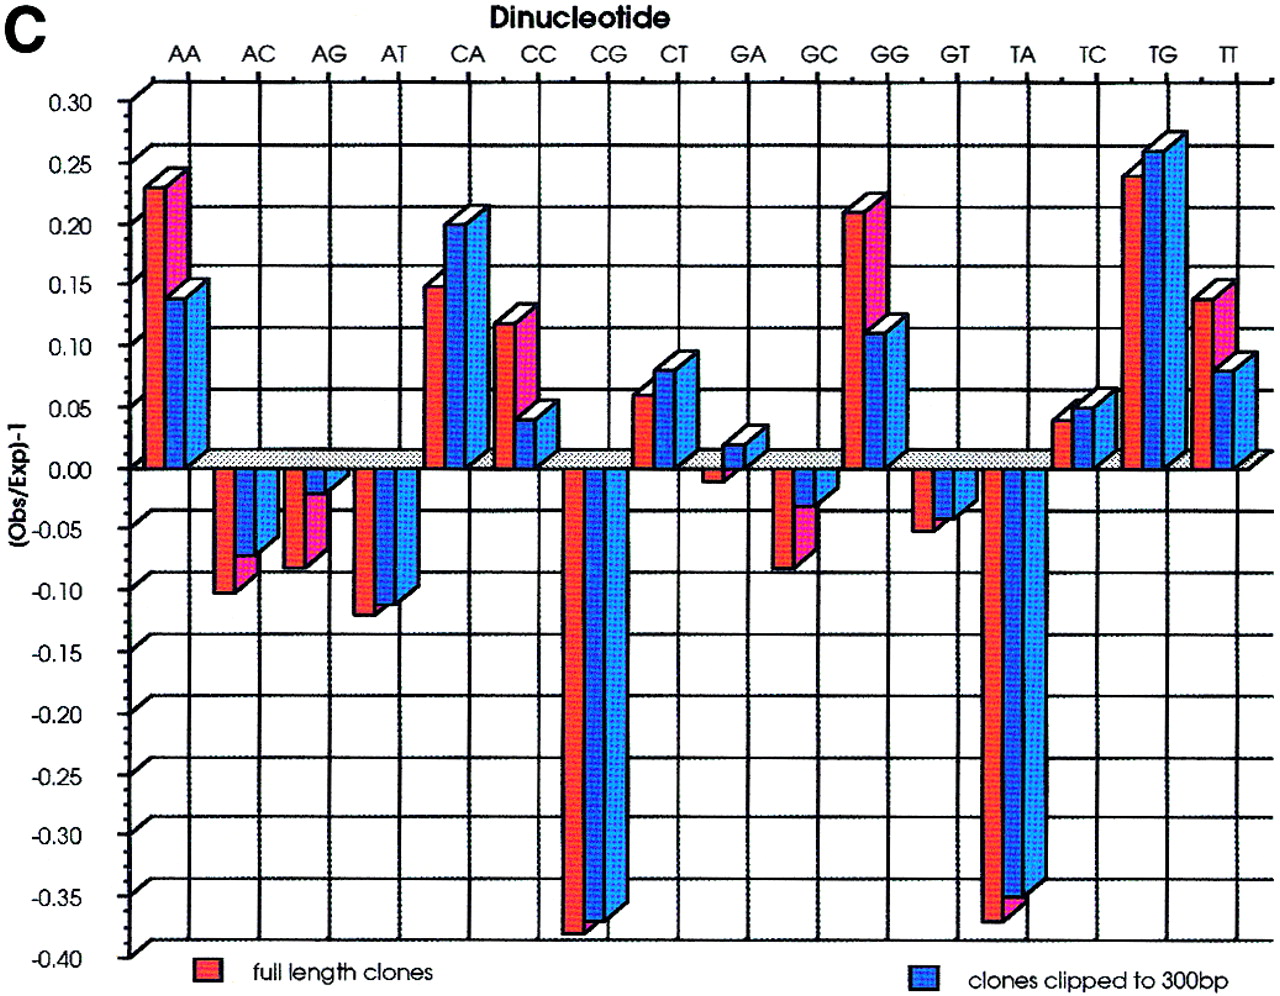
(A) A total of 52668 sequences were used to calculate the base frequencies. Ambiguous bases (Ns) were removed from the analysis on the assumption that they represent a roughly equal proportion of each of the 4 bases. (B) G+C content of each cosmid was calculated from the sequences derived from that cosmid. The G+C content of all sequences is also represented and shows a much wider distribution. (C) Dinucleotide frequencies are expressed as Observed (O)/Expected (E)-1. Negative values therefore correspond to dinucleotides that are suppressed, and positive values to those that are present at a frequency above that expected. Because the sequences have not been edited and have been allowed to run to 650 bp, there was concern that the quality of the data toward the end of sequences were poor. Therefore, the analysis was repeated after clipping all the sequences to 300 bp. The results are very similar to those from the whole data set, the only deviation being that the frequency of dinucleotides ApA, CpC, GpG, and TpT are slightly lower in the clipped data. This is due to broad peaks at the end of sequencing runs being mis-called as doublets of the same base.


