
Figure 2.
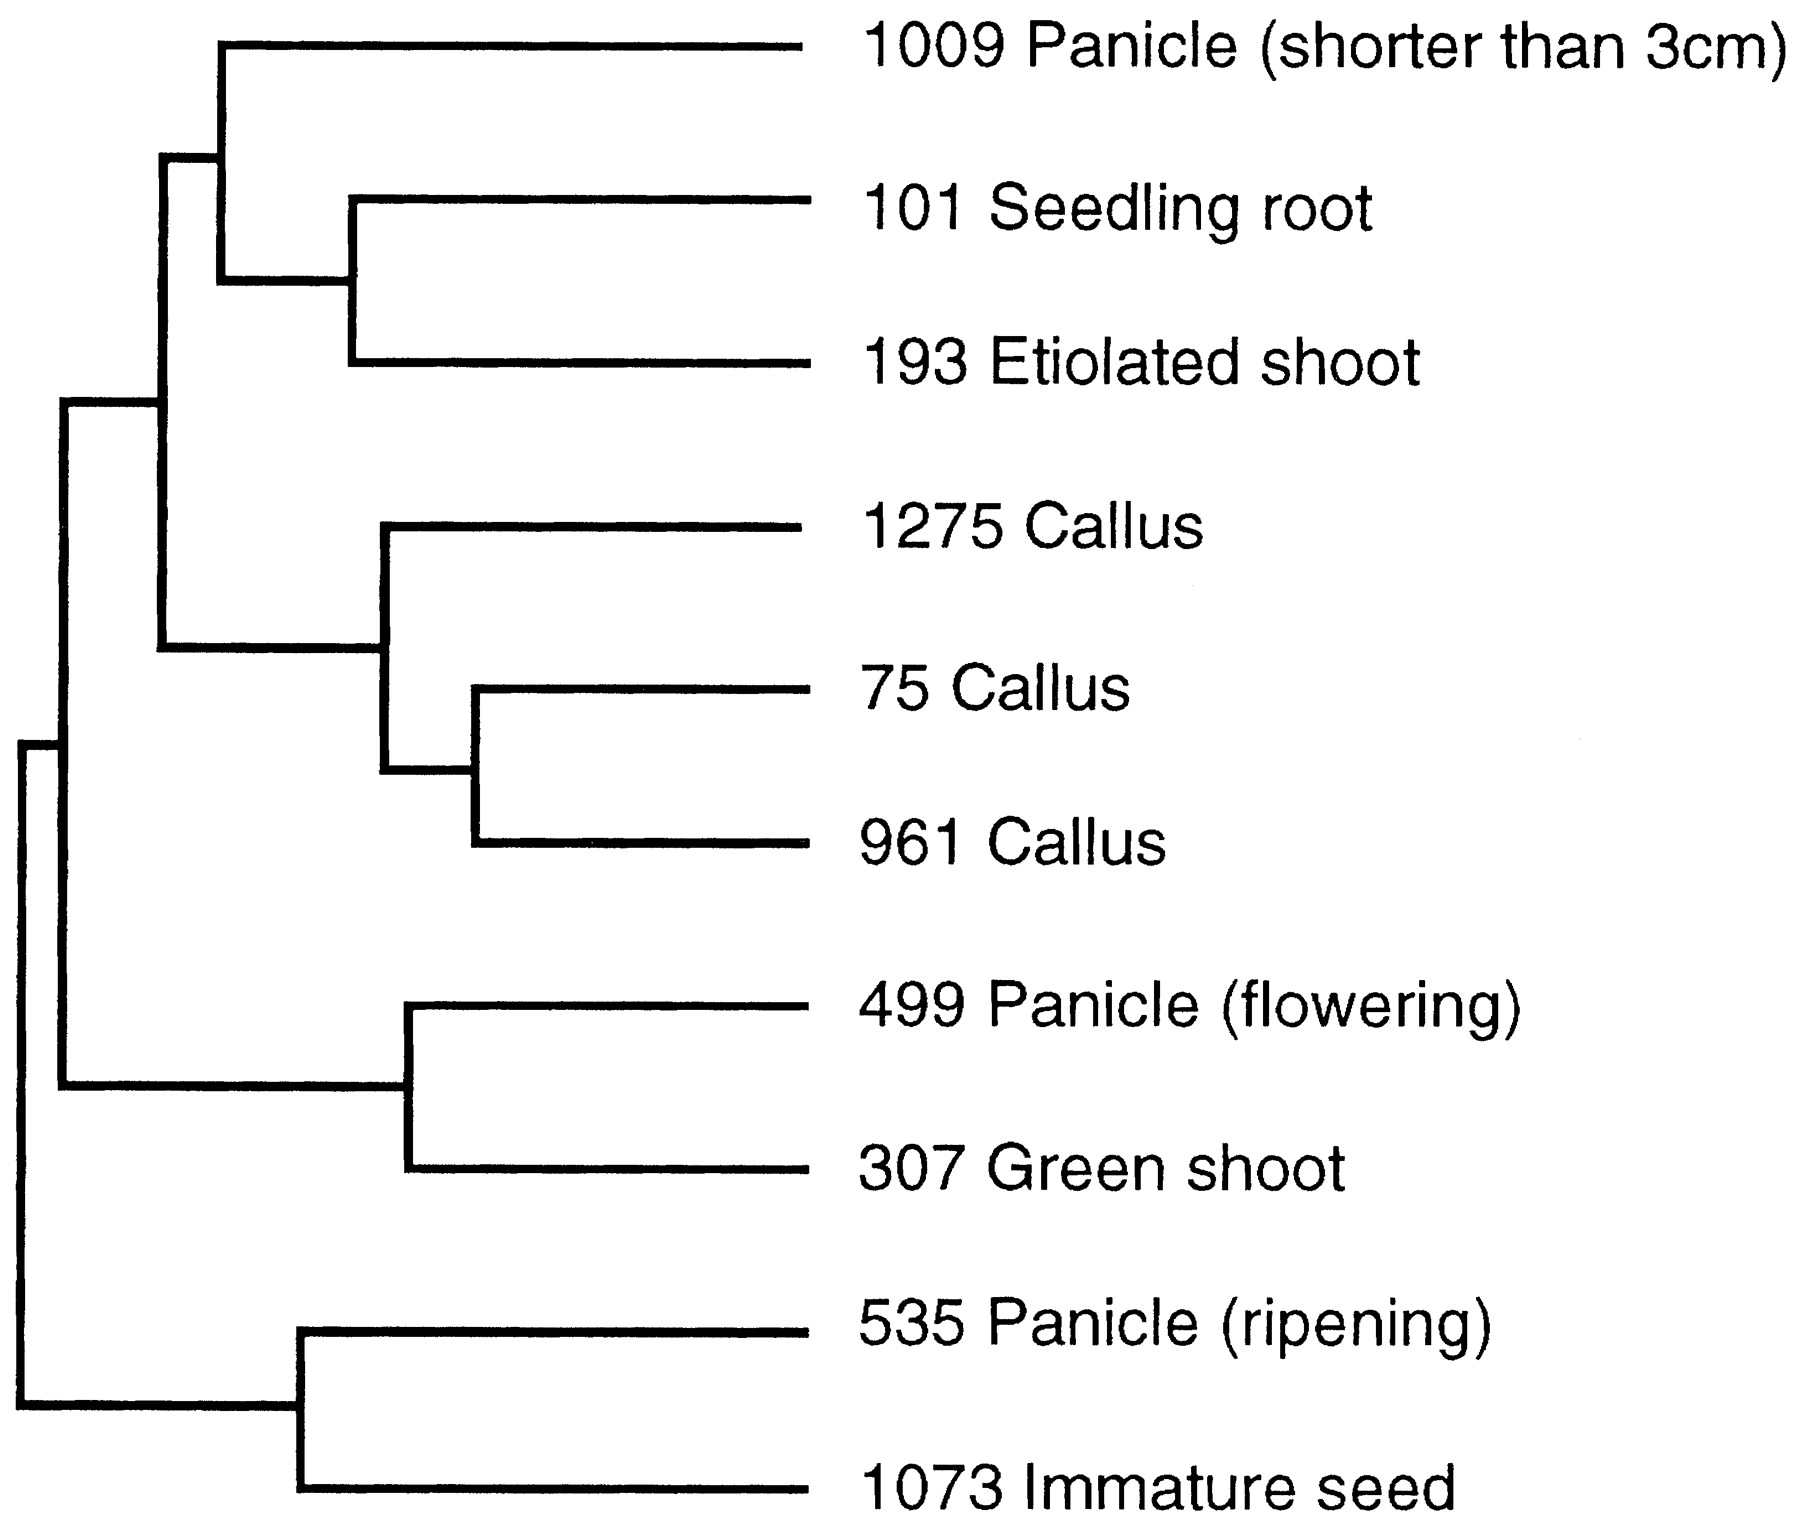
Dendrogram showing cDNA library similarities. Each library is identified by the dbEST library identifier and a short description.
(Downloading may take up to 30 seconds. If the slide opens in your browser, select File -> Save As to save it.)
Click on image to view larger version.
Dendrogram showing cDNA library similarities. Each library is identified by the dbEST library identifier and a short description.
 CiteULike
 Delicious
 Digg
Digg Facebook
 Google+
 Reddit
 Twitter
