
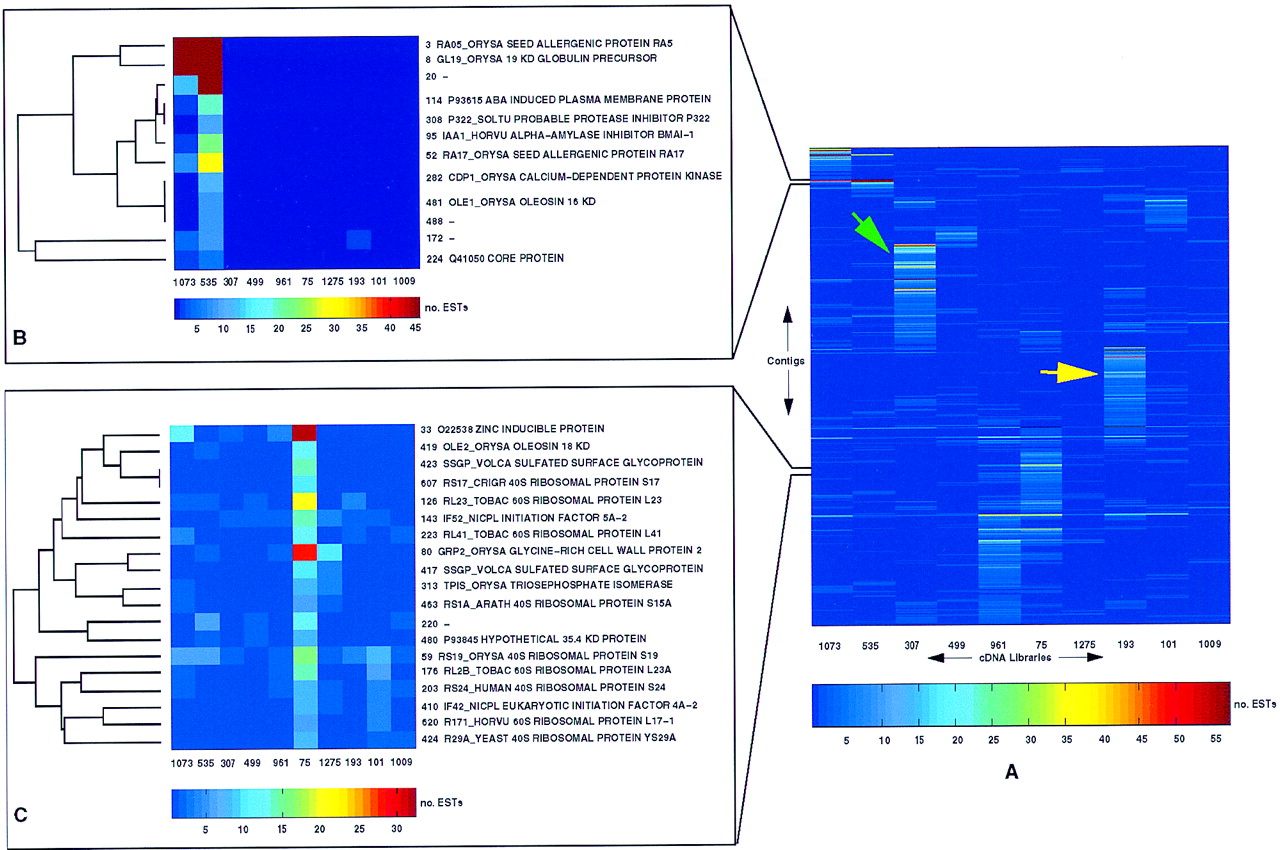
Clustered correlation map of the rice EST data. (A) The complete clustered correlation map of 707 contig sequences vs. 10 cDNA libraries is shown. Library identifiers (dbEST library identifiers, see Table 1) identify each library; contig identifiers are not shown in full, but are shown for each of the expanded regions in B andC. Absolute numbers of ESTs are represented according to the color scale shown below the map. Note that because of restrictions on the number of distinguishable colors, the color scale has been chosen so as to optimally represent a portion of the data (those cells with EST counts between 5 and 55; all cells with a value >55 are assigned the color red). The green and yellow arrows have been placed to show how the map might be used to identify groups of genes with particular expression patterns. In this case, the green arrow indicates a block of genes principally expressed in library 307 (green shoot, 8 days old) and the yellow arrow a block of genes principally expressed in library 193 (etiolated shoot, 8-days old). (B,C) Expanded regions of the clustered correlation map. To the right of each region, contigs are identified by contig number and putative identification (SWISS-PROT/TrEMBL identifier and description), if available. To theleft of each region, the relevant portion of the dendrogram used to reorder the original data table is shown. Note the differences in color scale for A, B, and C, as the color scale was chosen in each case to optimally represent the required interval of EST counts.


