
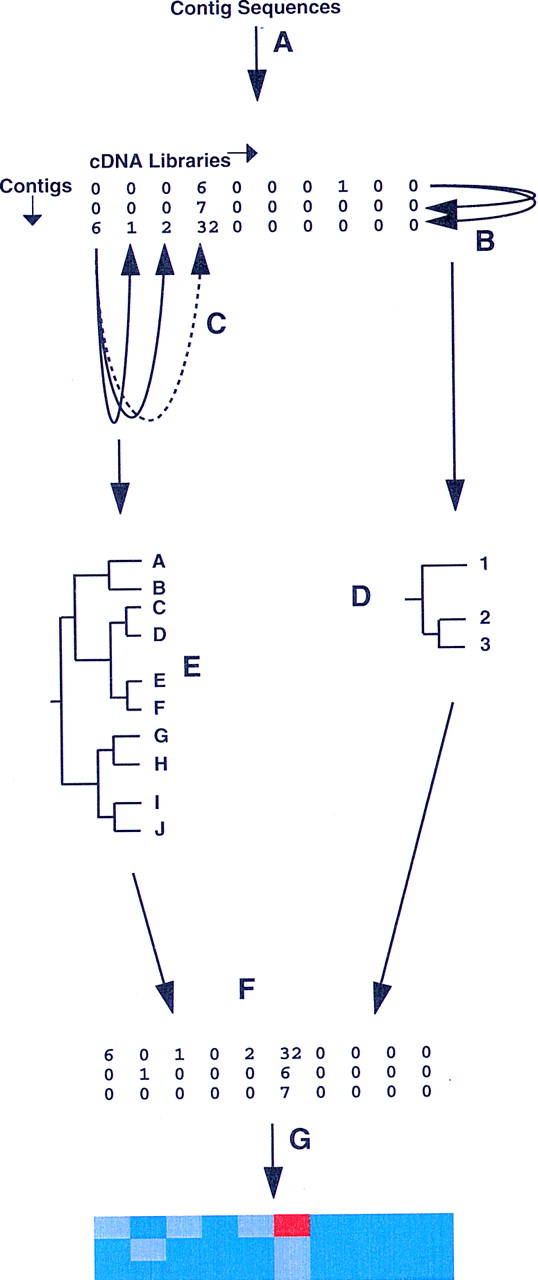
Overview of the procedure. (A)Derivation of expression profiles from each valid contig sequence (those representing five or more ESTs from the 10 cDNA libraries used) to form the primary data table in which contig sequence are arrayed in rows and cDNA libraries in columns. In the illustration, a hypothetical matrix of 3 contigs (1–3) by 10 libraries (A–J) is shown. (B,C) Pairwise calculation of similarity (Pearson correlation coefficient) between contig (row) and library (column) profiles, respectively. (D,E) Calculation of Euclidean distances for each contig/contig or library/library pair from Pearson coefficient matrices, and generation of contig (D) and library (E) dendrograms. (F) Separate reordering of rows (contigs) and columns (libraries) in the original data table, according to the hierarchical order in the contig and library dendrograms. In the reordered data table, similar contigs or similar libraries are adjacent. (G) Representation of the reordered data table as a clustered correlation map, in which the color in an individual cell reflects the underlying EST count.


