
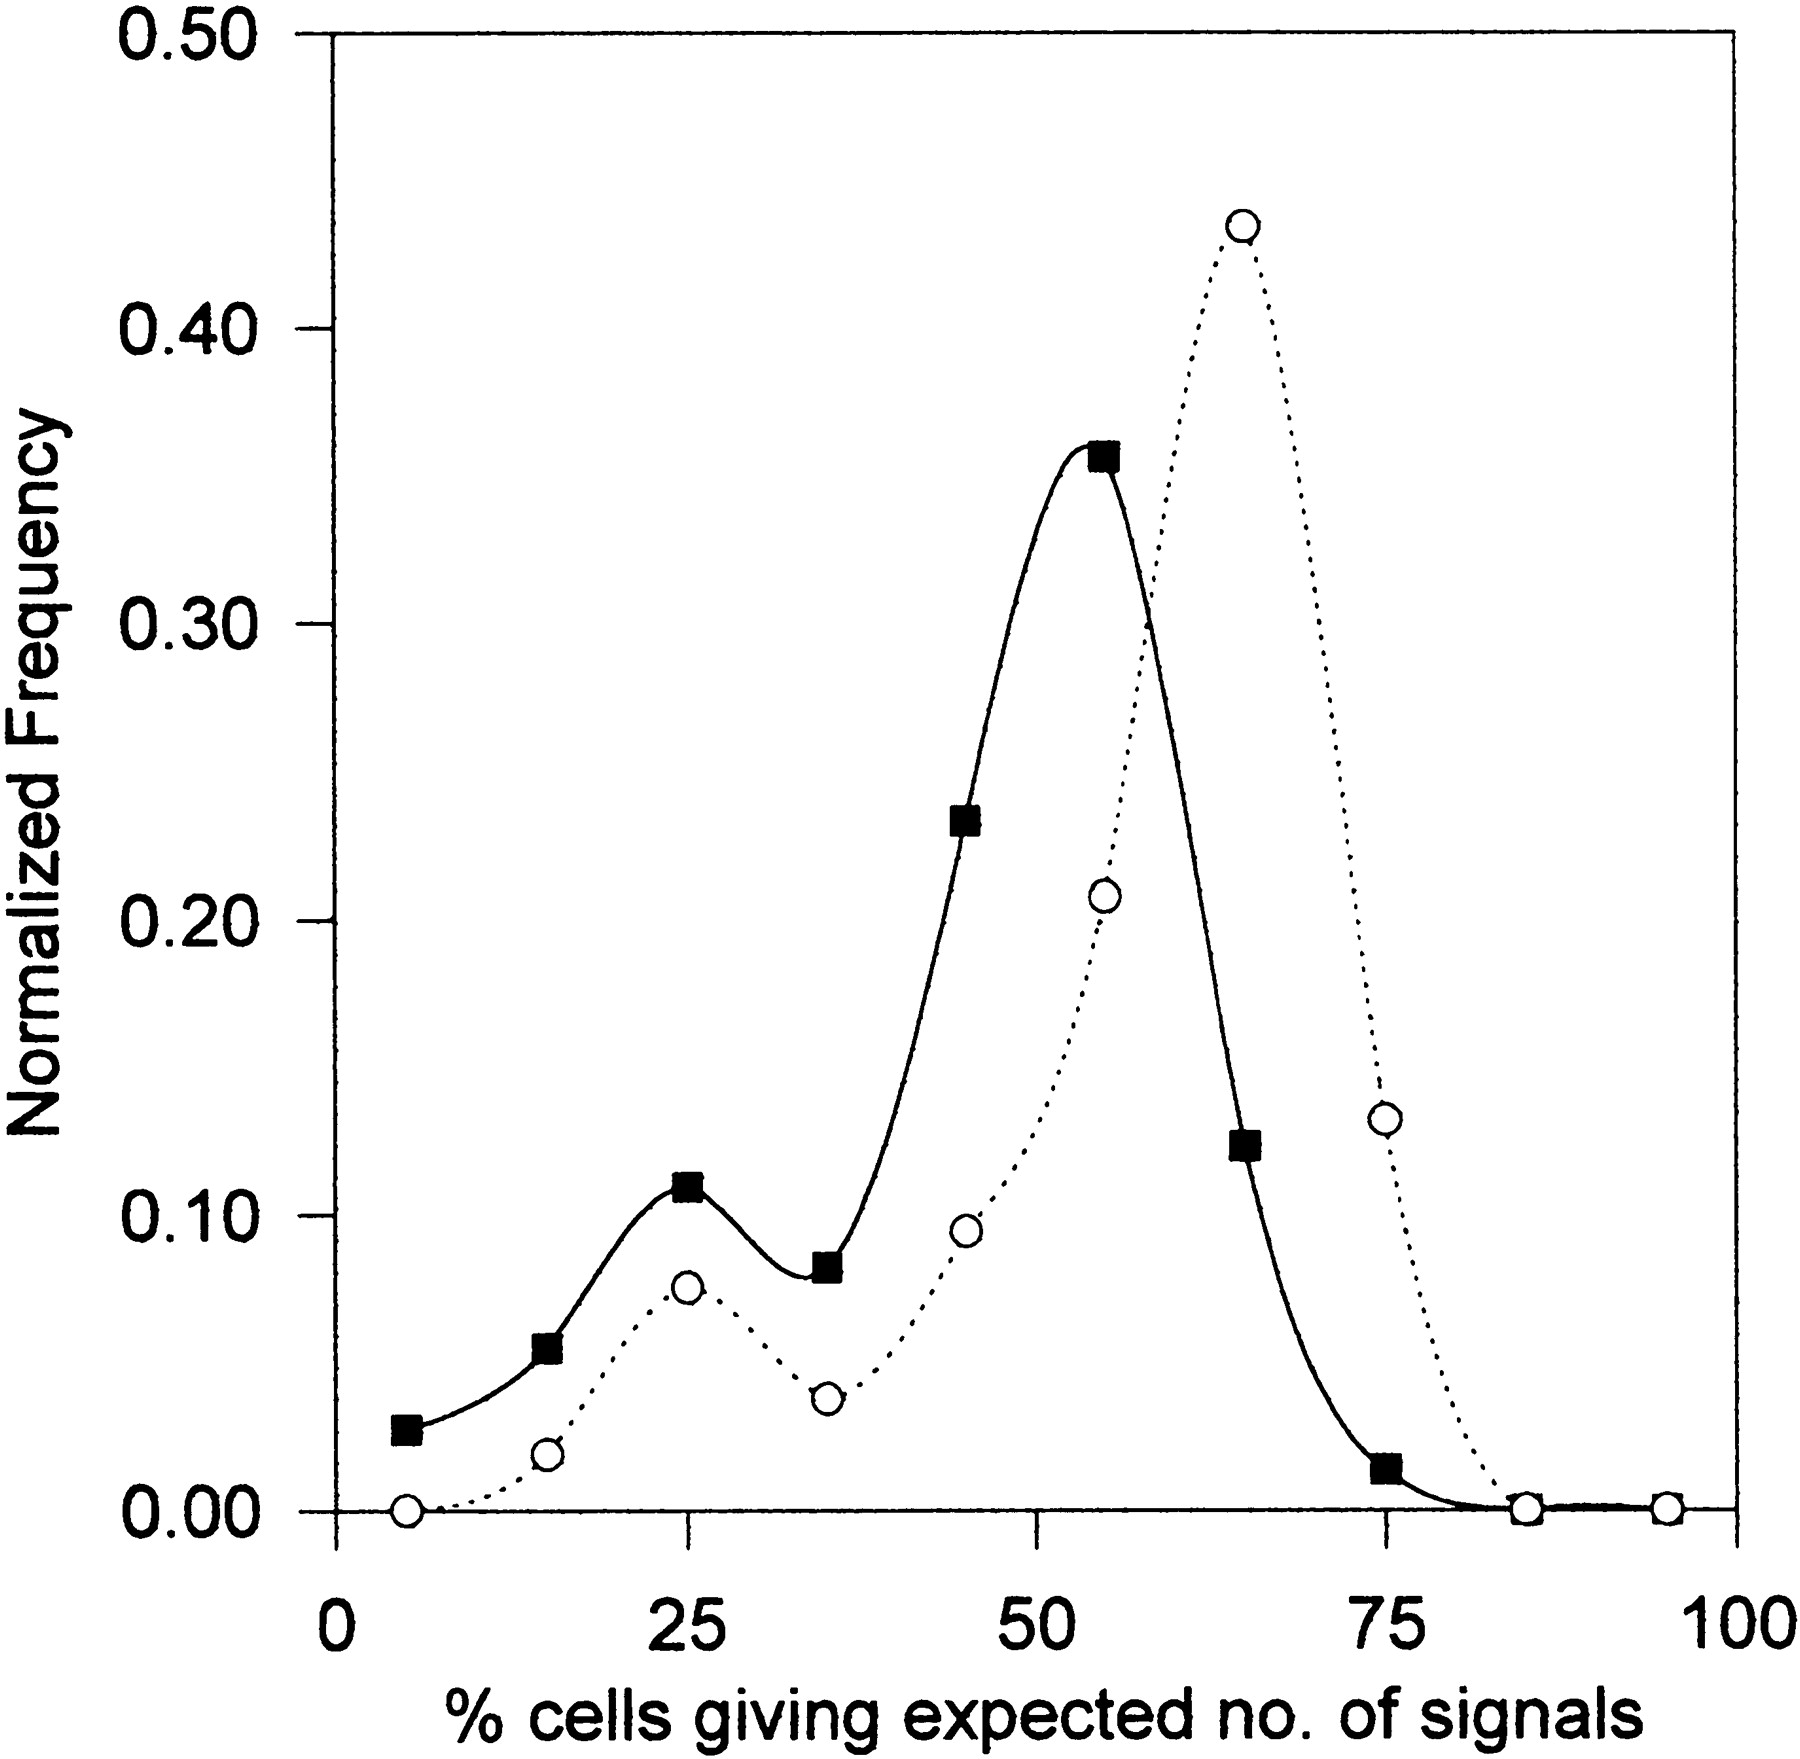
Figure 7.
Relative frequency distribution curves of interphase FISH using the probe αRI performed on a cohort of 73 DS cell lines (◼). (○) The results derived from Fig. 1 of the control group using the same probe. Horizontal axis represents the percentage of cells in each cell line showing the expected five interphase FISH signals for DS cells. Data points represent the mid-values of the bins (in the range of 10%) used for the construction of the frequency distribution diagram. Vertical axis denotes the number of cell lines in each bin expressed as a fraction of the total number of cell lines investigated.


