
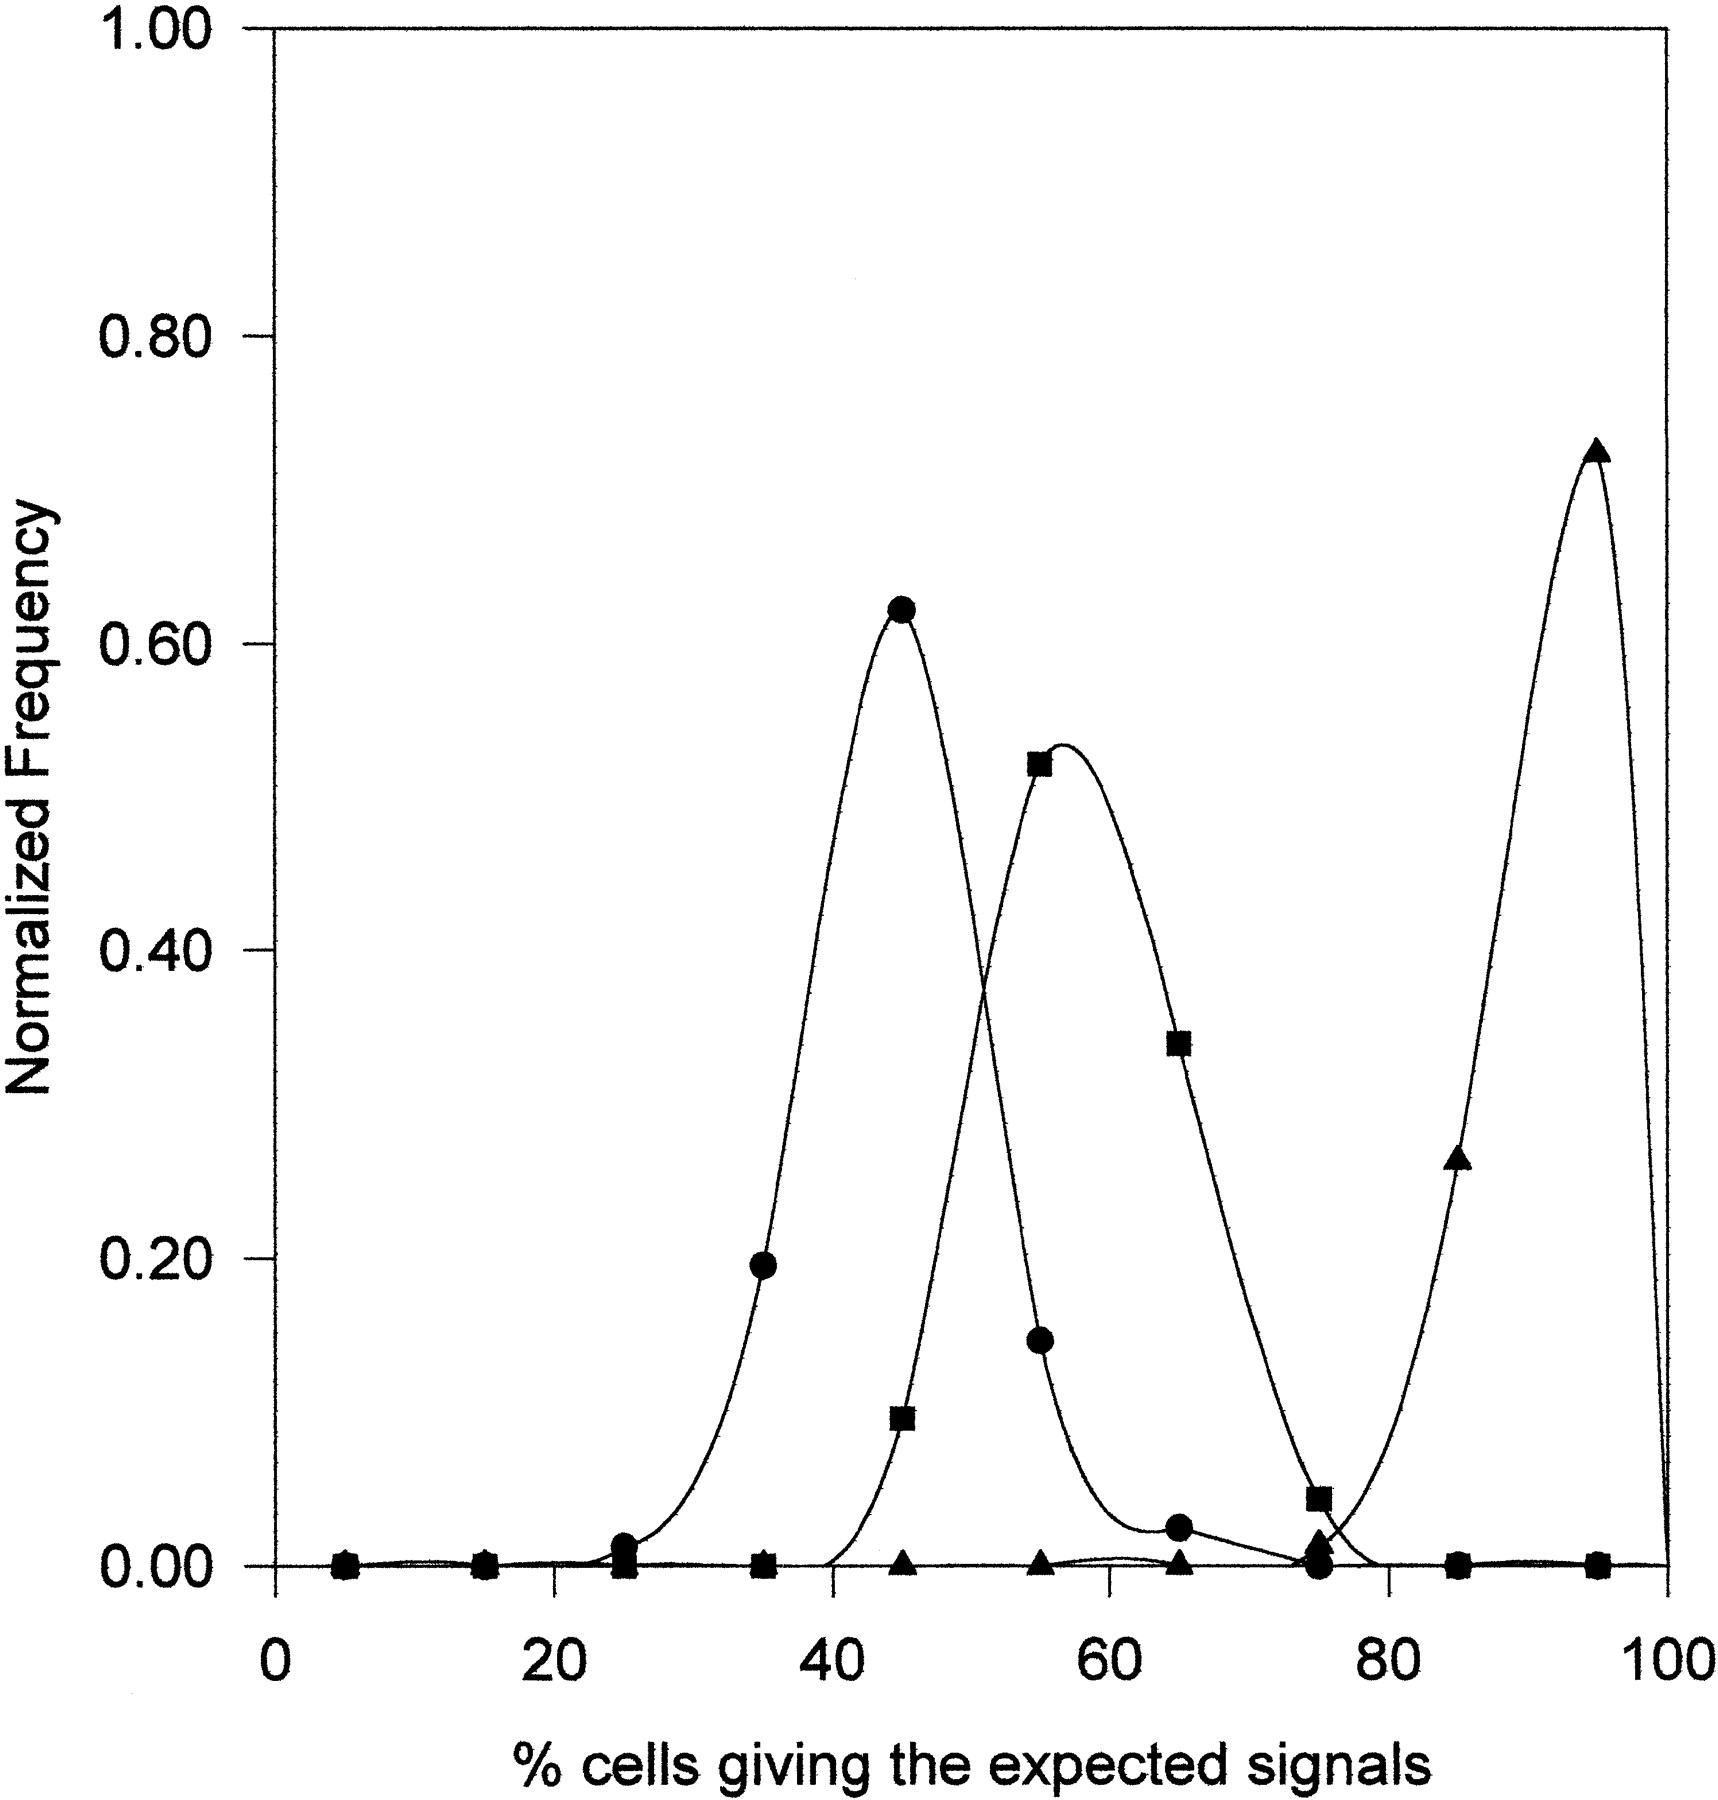
Relative frequency distribution curves of interphase FISH performed to recreated artifically the scoring of four (●) and five (◼) signals on cytogenetically normal control subjects. Data points represent the mid-values of the bins (in the range of 10%) used for the construction of the frequency distribution diagram. The horizontal axis represents the percentage of cells within a cell line giving the expected number of signals. The vertical axis denotes the number of cell lines in each bin expressed as a fraction of the total number of cell lines investigated for each of the reconstruction experiments. Four signals were produced using a combination of probes, pB12 and TR17, specific for chromosomes 12 and 17, respectively (n = 112). Five signals were produced using a combination of the same probes together with the Y chromosome probe, pLAY5.5, on male subjects (n = 86). The data for chromosome 17 (▴) from Fig. 1 as an example of scoring two signals were reproduced for comparison.


