
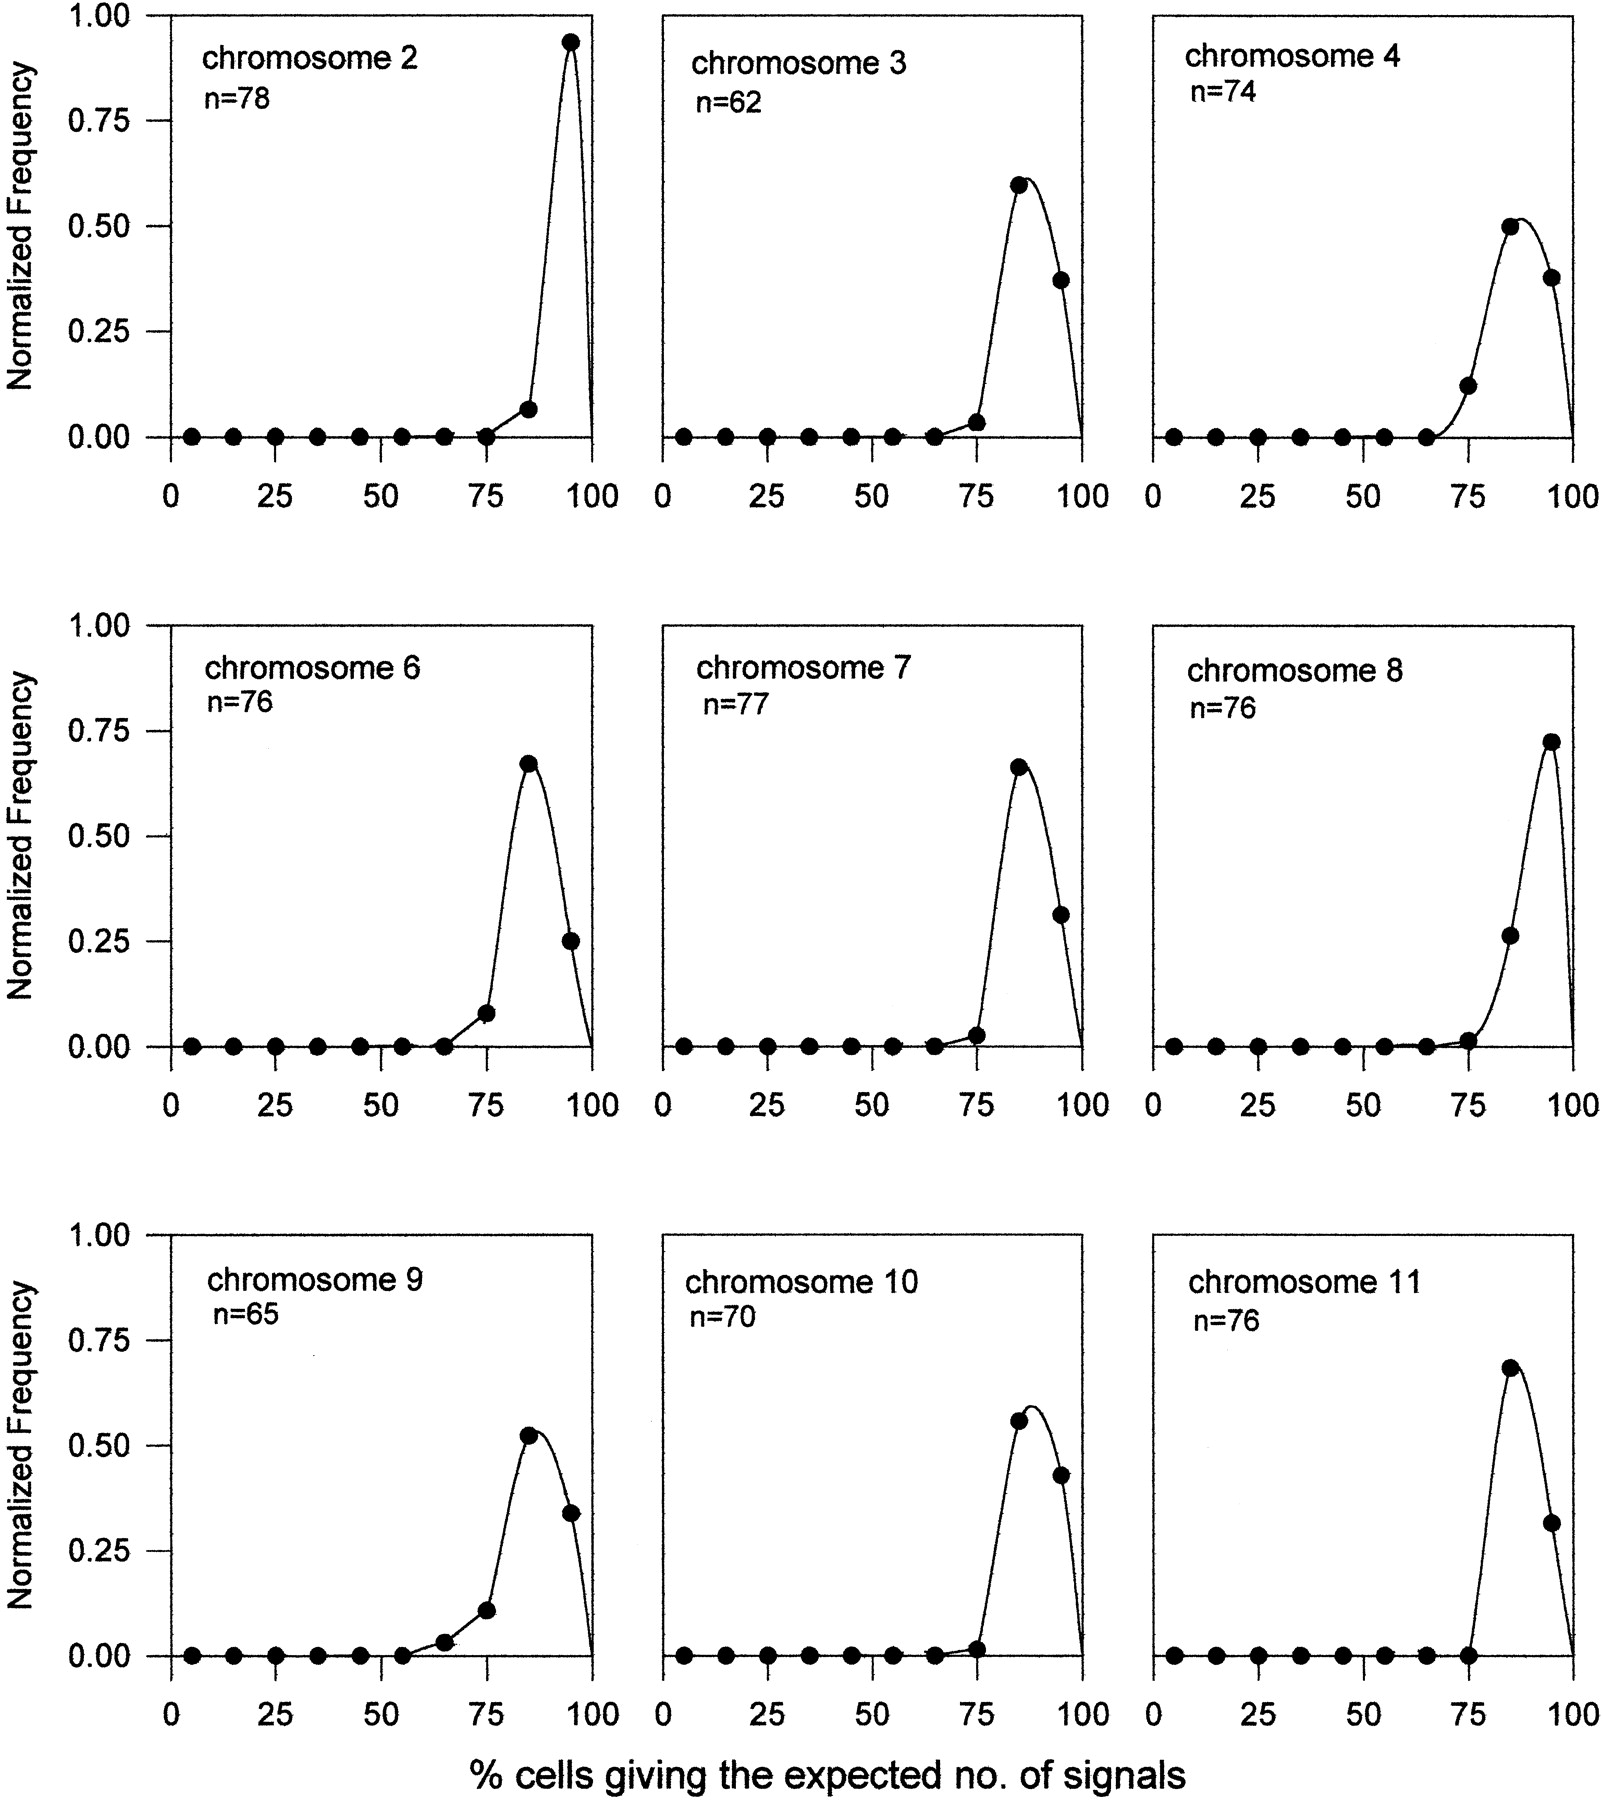
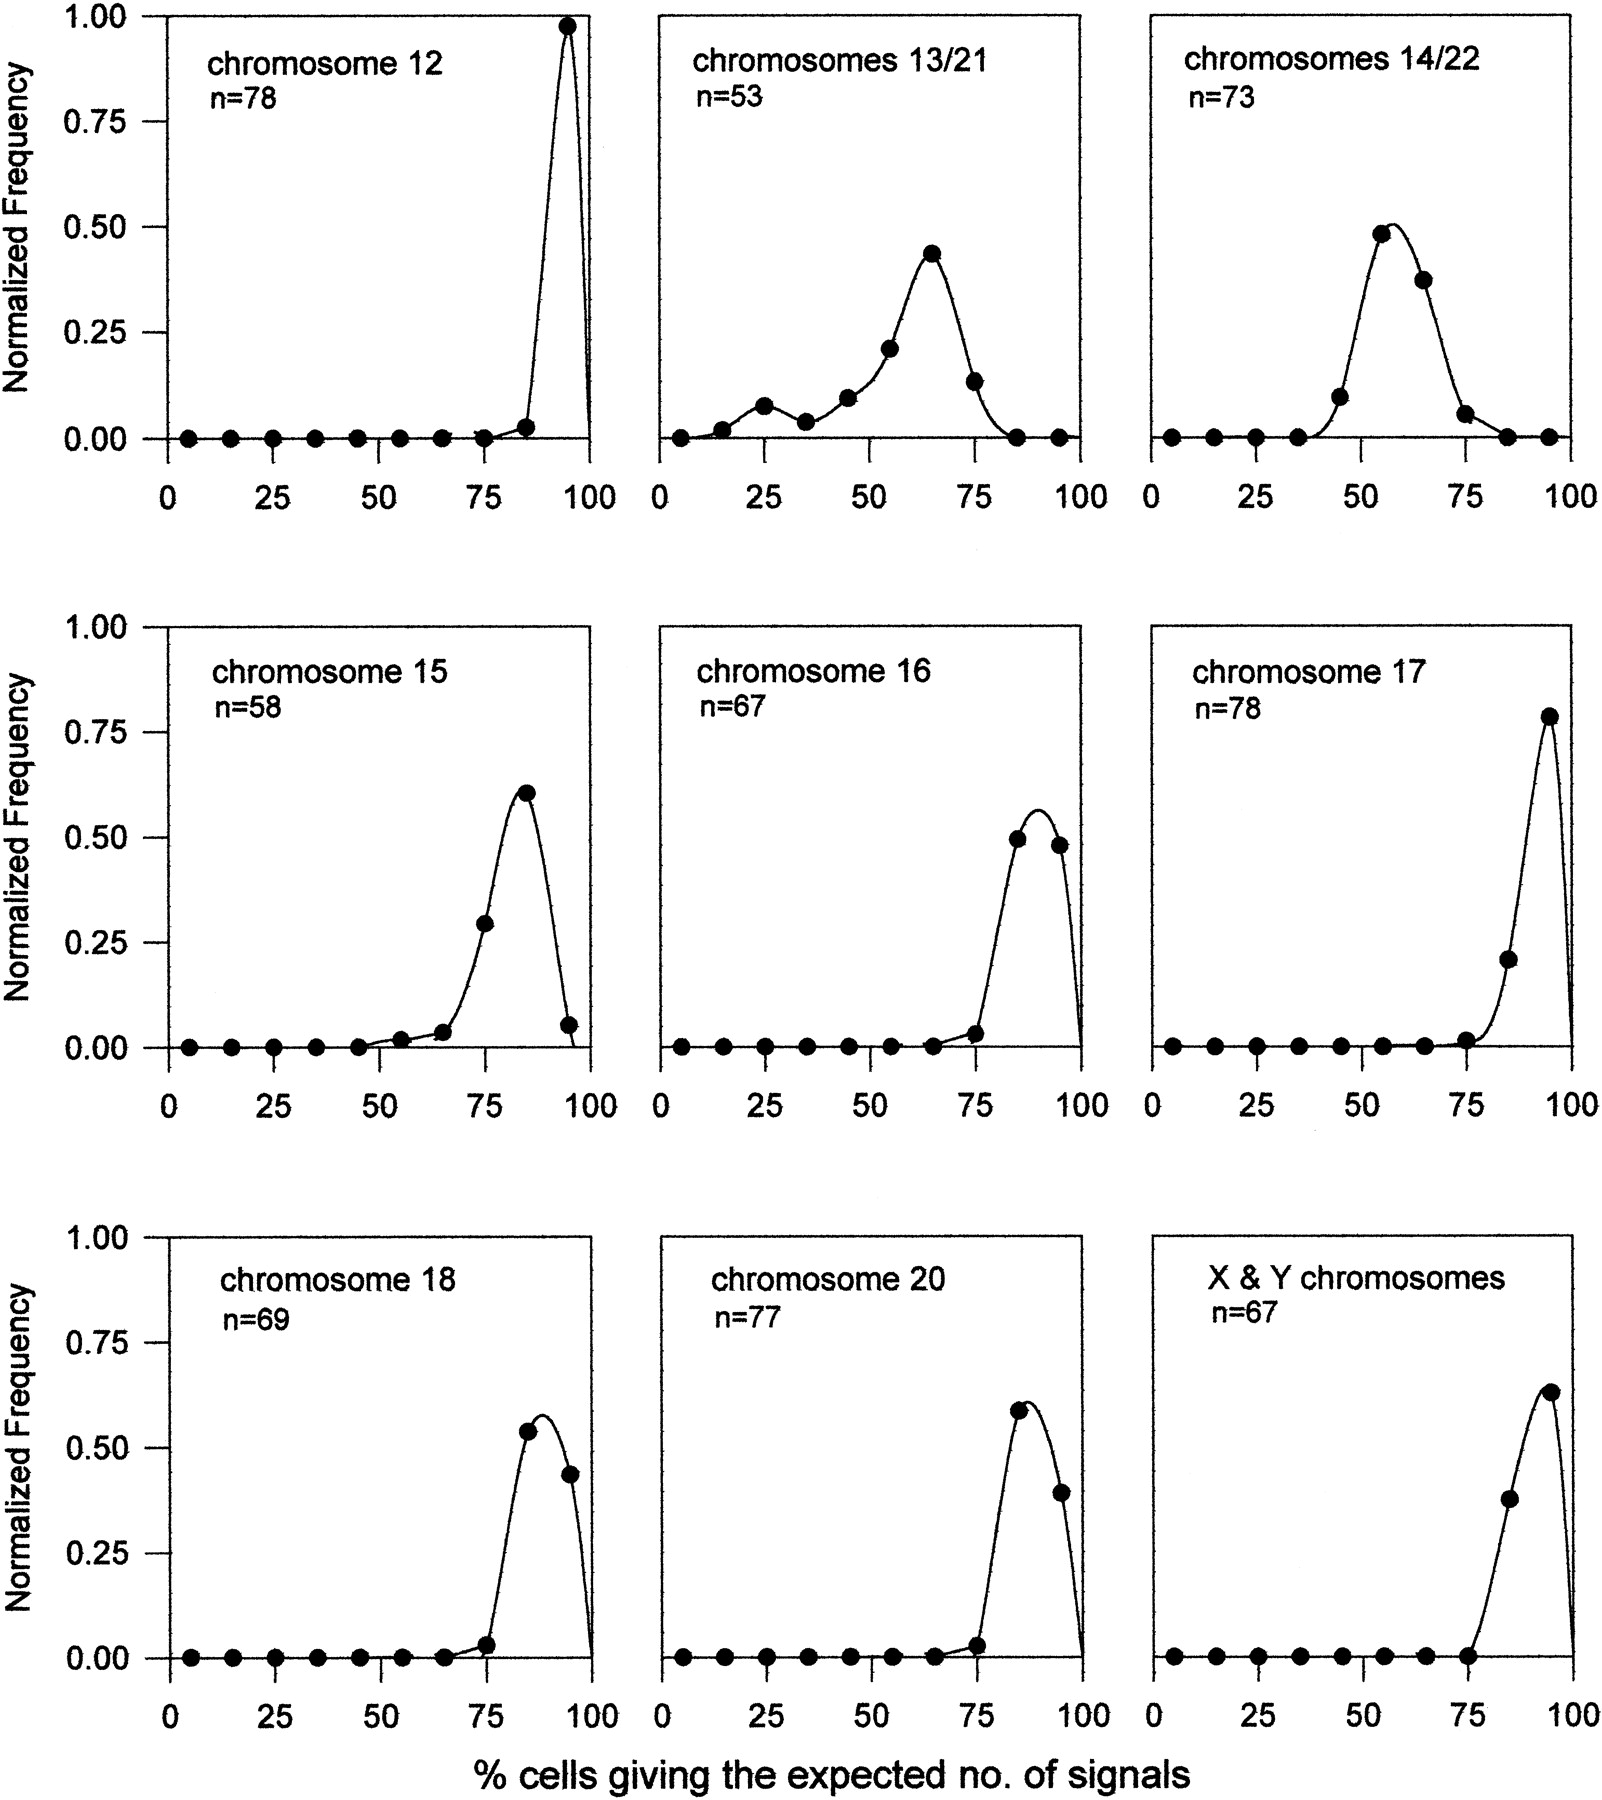
Figure 1.
Relative frequency distribution curves of interphase FISH performed with chromosome-specific α-satellite probes (see Table 1) on cytogenetically normal subjects. Horizontal axes represent the percentage of cells in each cell line showing the expected number of interphase FISH signals. Data points represent the mid-values of the bins (in the range of 10%) used for the construction of the frequency distribution diagram. Vertical axes denote the number of cell lines in each bin expressed as a fraction of the total number (n) of cell lines investigated.


