
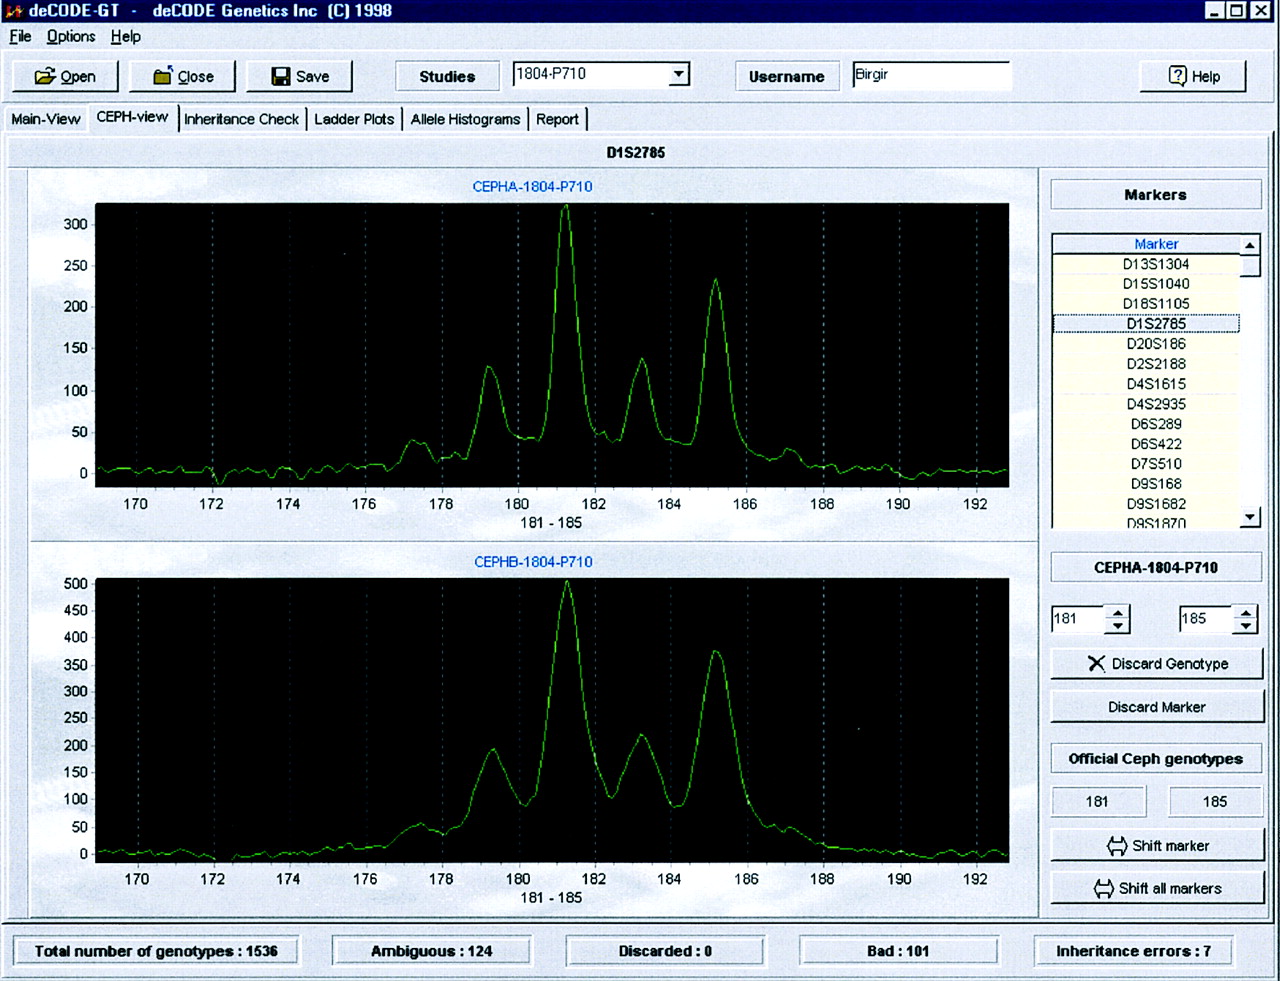
Figure 7.
Decode-GT shows the electopherograms for the CEPH controls and also lists the known reference genotype for the selected marker.
(Downloading may take up to 30 seconds. If the slide opens in your browser, select File -> Save As to save it.)
Click on image to view larger version.
Decode-GT shows the electopherograms for the CEPH controls and also lists the known reference genotype for the selected marker.
 CiteULike
 Delicious
 Digg
Digg Facebook
 Google+
 Reddit
 Twitter
