
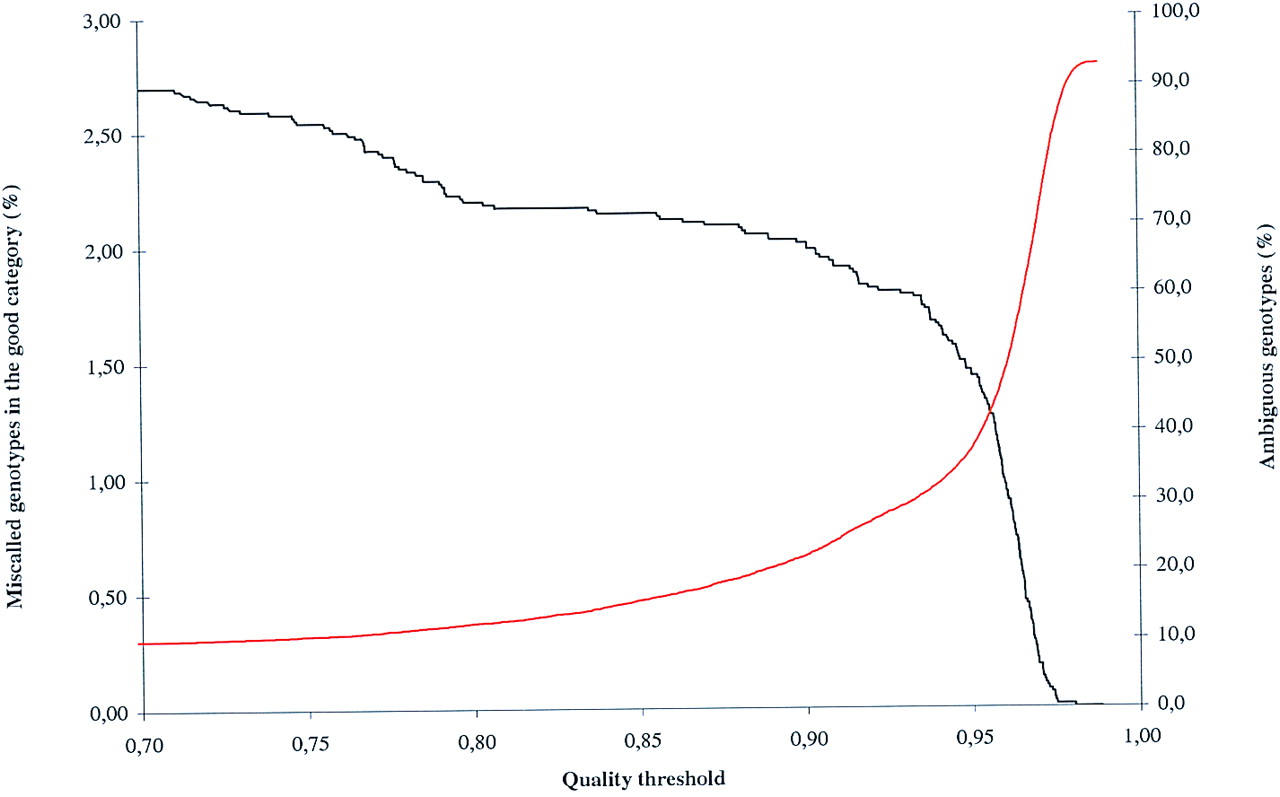
The quality value provided by TA is used to categorize genotypes in the ambiguous category. The graph shows how the size of the ambiguous category (red line) increases and how the number of miscalls (black line) that are not listed as ambiguous decreases as the quality threshold value changes from 0.7 to 1. At quality threshold value 0.8, the decrease in miscalls in the ambiguous category levels off and the ambiguous category does not rise significantly. At quality threshold >0.9, the number of miscalls starts to decrease rapidly but the ambiguous category expands just as rapidly. On this basis, the quality threshold value was set at 0.8.


