
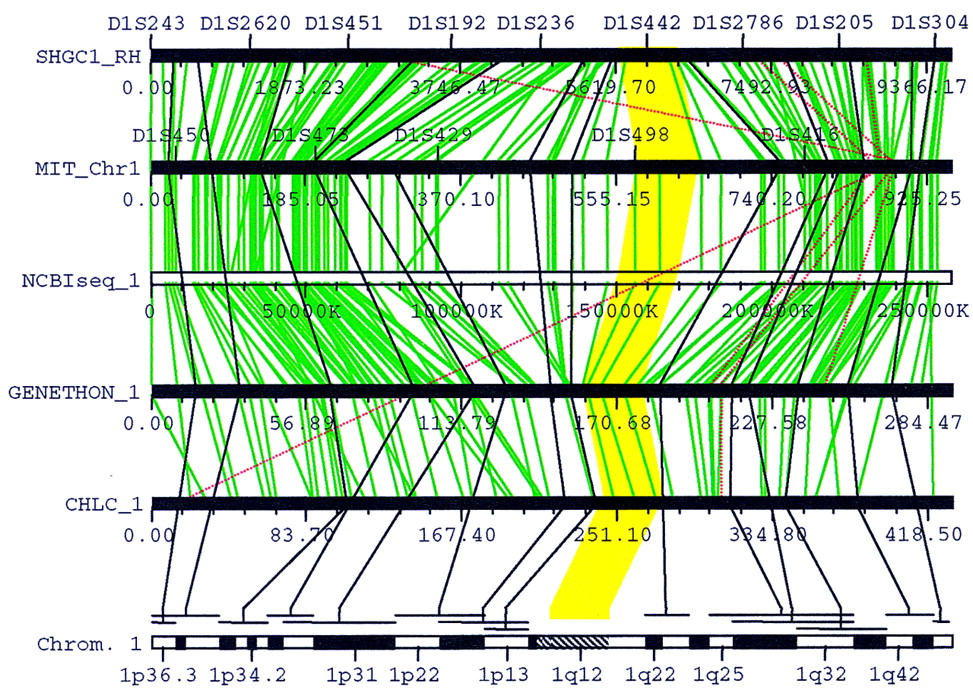
Figure 3.
Mapping a cytogenetic band by interpolation. 1q12 is a band with no FISH mapping data. The yellow polygon highlights the regions that corresponds to 1q12, which were interpolated from the flanking FISH-mapped bands 1p13 and 1q22–q23.


