
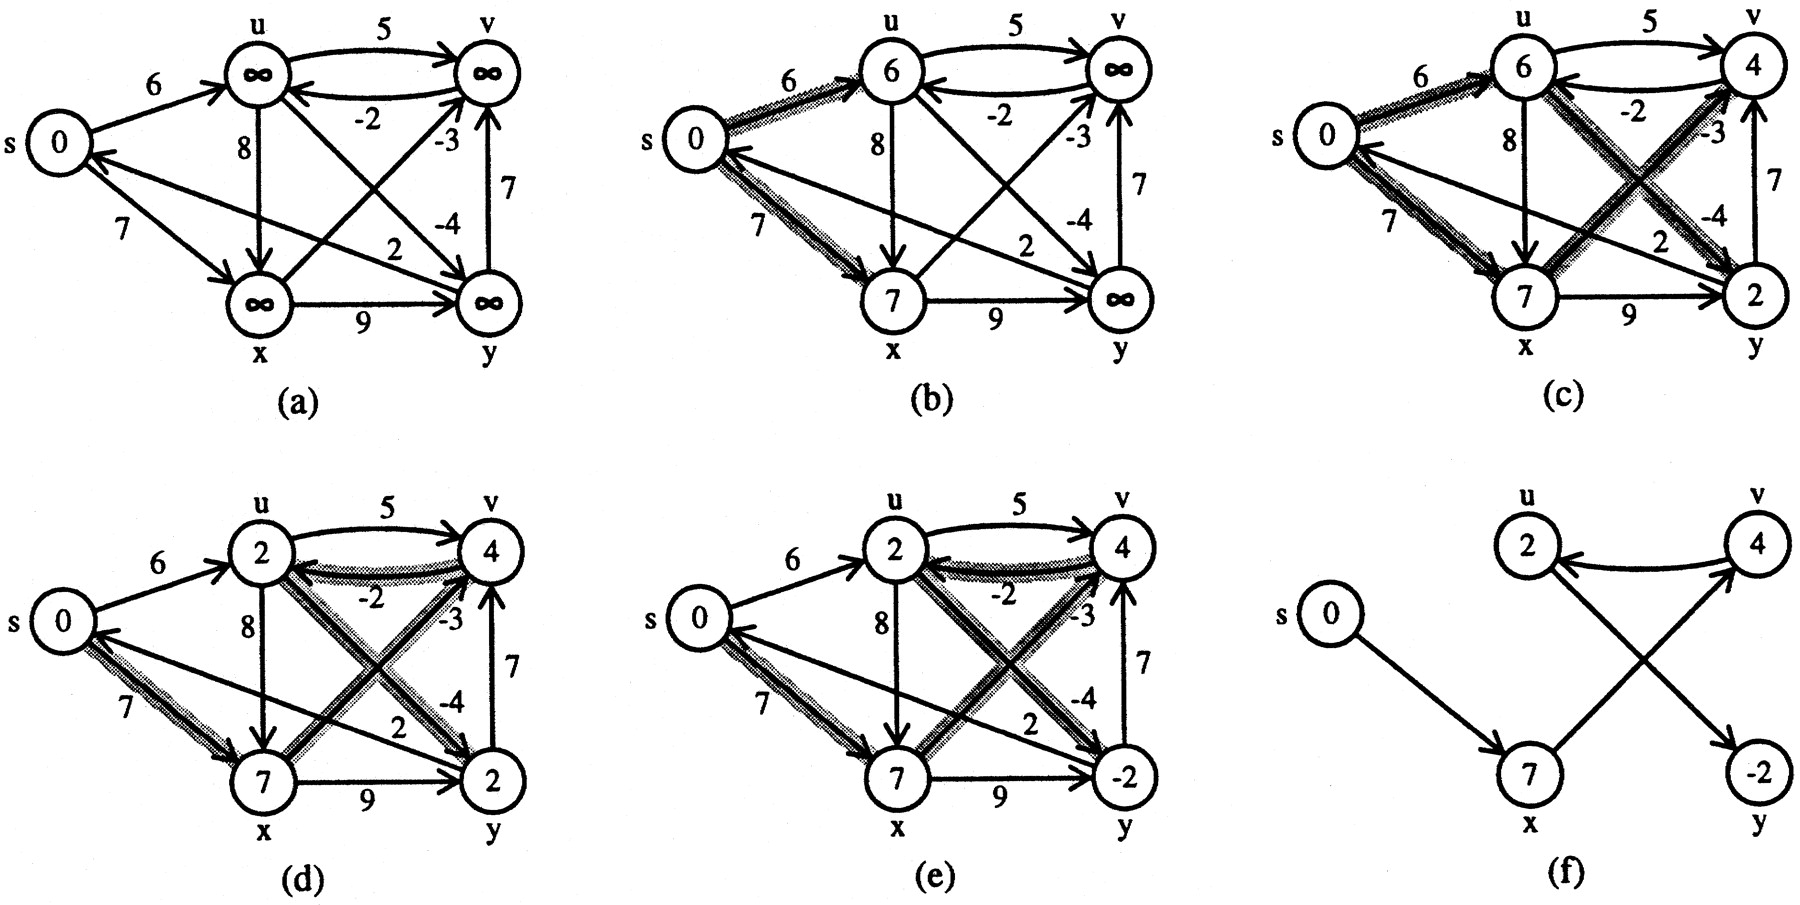
Representations of various intermediate stages of Bellman–Ford algorithm when applied to the simple system of difference constraints in equation 6. In this case, the source vertex is s, and the upper bounds ɛ for each variable, which measure the shortest path from s to the associated vertex, are displayed within the vertices. Predecessor relationships are indicated by the shaded edges, such that if π(u) = s, the edge from sto u is shaded. The relaxation process is applied to the inequalities (edges) in the order in which they appear in equation 6. (a) The graph after initialization and prior to the first round of relaxations; (b–e) the state of the estimates after each complete pass through all inequalities. The algorithm ultimately ends at the shortest path found in e where the shortest distance estimates are shown in each vertex. f simply highlights the final solution for this system; here, only the edges lying on the shortest path are displayed, and the distances to each vertex along that path are shown inside the vertices.


