
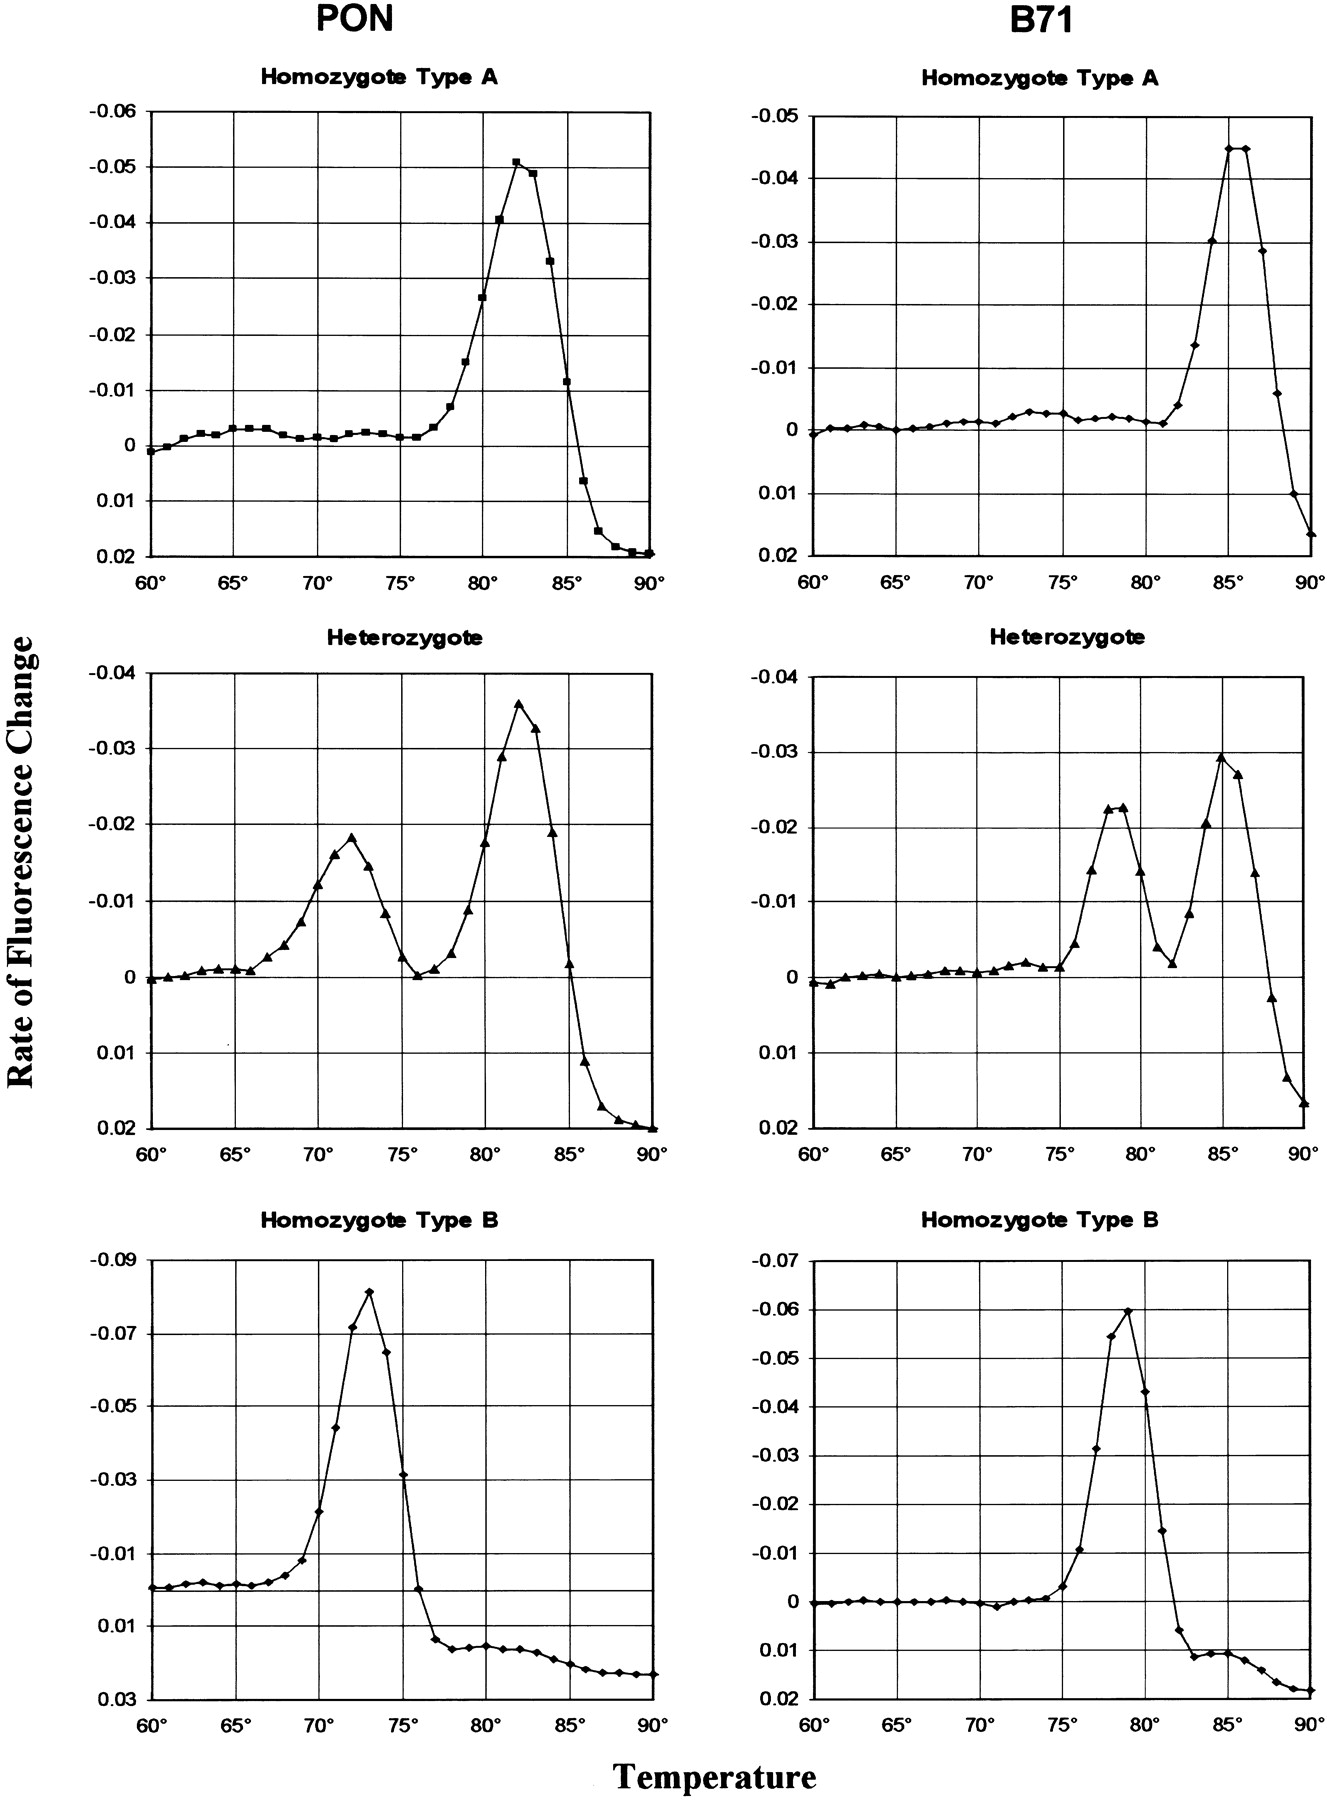
Figure 2.
Melting profiles. Three samples, one of each genotype, for the PON and the B71 single-nucleotide polymorphisms. Genotyping and interpretation of melting curves as described in the text. The three genotypes are easily distinguished by visual inspection of the graphs.


