
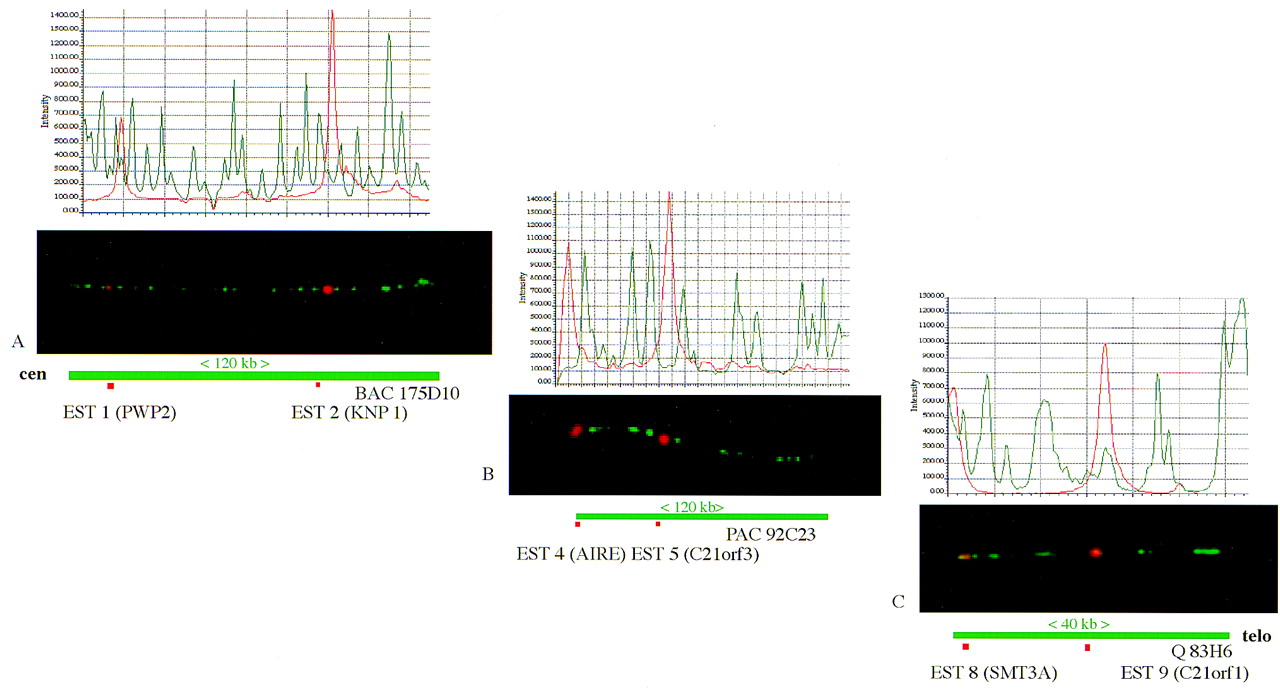
An illustration of a visual transcript map. Red signals are hybridization signals from EST probes, green signals form underlying large insert clones. (A) The centromeric side of the map included ESTs 1 and 2 corresponding to the PWP2 and KNP 1 genes, respectively. (B) The central part of the map included ESTs 4 and 7 representing the AIRE and theC21orf3 genes, respectively. (C) The telomeric part of the map included ESTs 8 and 9 corresponding to the SMT3Aand C21orf1 genes, respectively. In all images, the long-range clone is detected by FITC (green) and the ESTs are detected by biotinylated tyramide with Texas Red (red). The histograms on the upper side of the FISH images show the precise positions of the ESTs as red peak on a long-range clone.


