
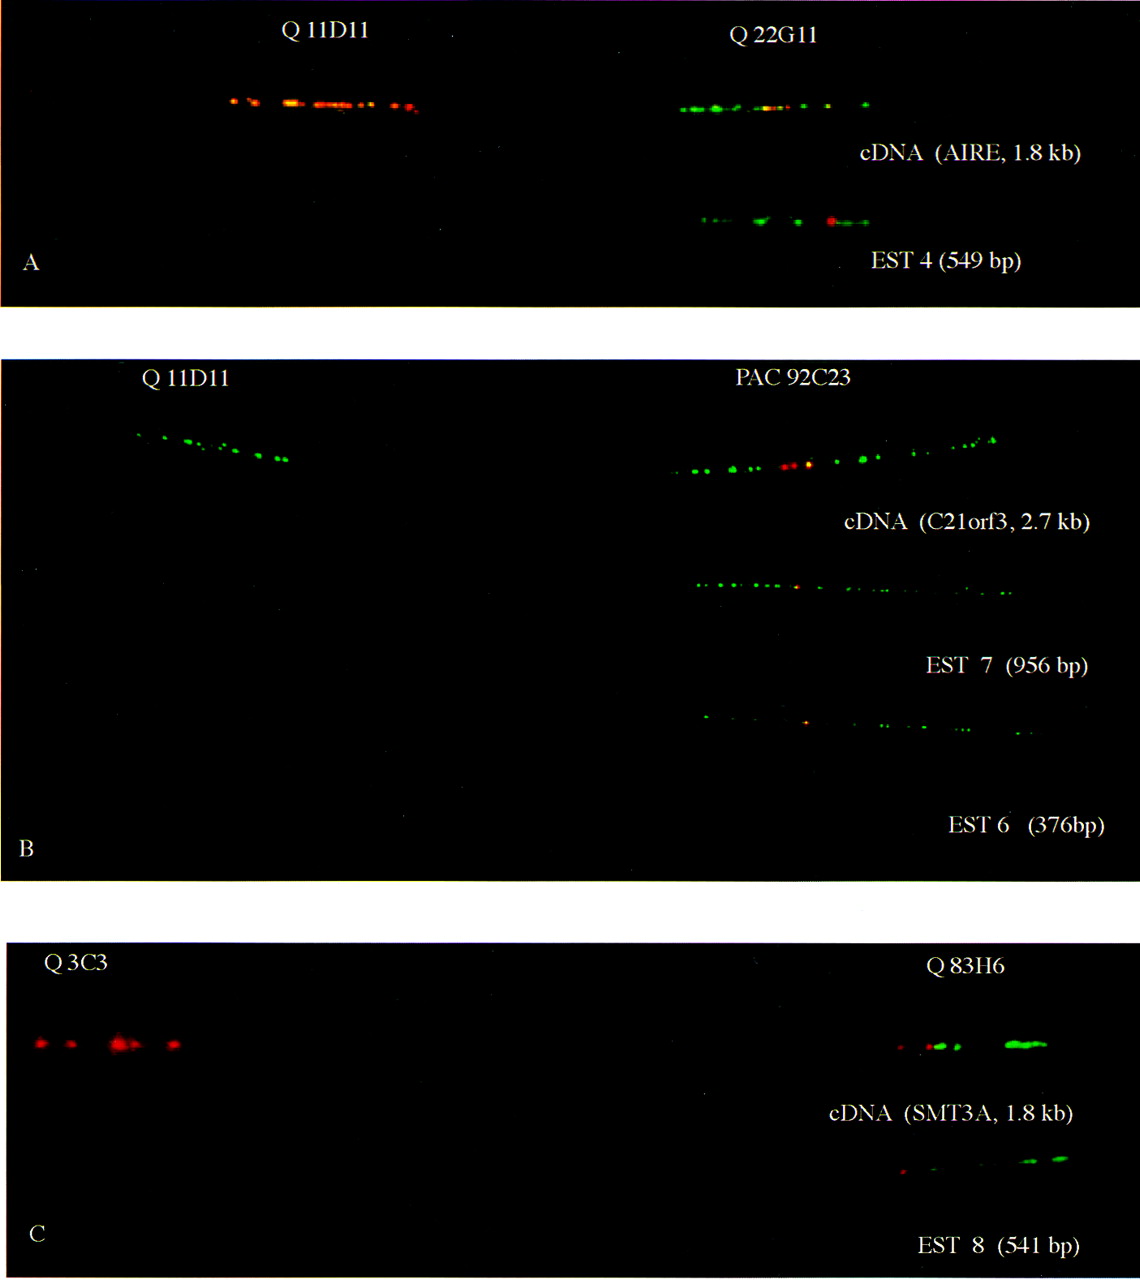
An illustration of the specificity of ESTs mapping procedure. The assignment of ESTs to the same position as the corresponding cDNA is demonstrated. (A) The AIRE gene is visualized with a cDNA clone (B1-1, 1.8 kb) and an EST 4 (549 bp) equally on top of a cosmid clone Q22G11. The cosmid clone Q11D11 (marker D21S25) serves as an orientation marker at top. (B) TheC21orf3 is assigned with a cDNA clone (21919, 2.7 kb) and two ESTs (956 and 376 bp) on a PAC clone 92C23. The cosmid clone Q11D11 serves as an orientation marker. (C) The SMT3A gene was localized with a cDNA clone (L2328, 1.8 kb) and the corresponding EST (541 bp) on a cosmid clone Q83H6 in relation to the cosmid clone Q3C3 (marker D21S171) serves as an orientation marker.


