
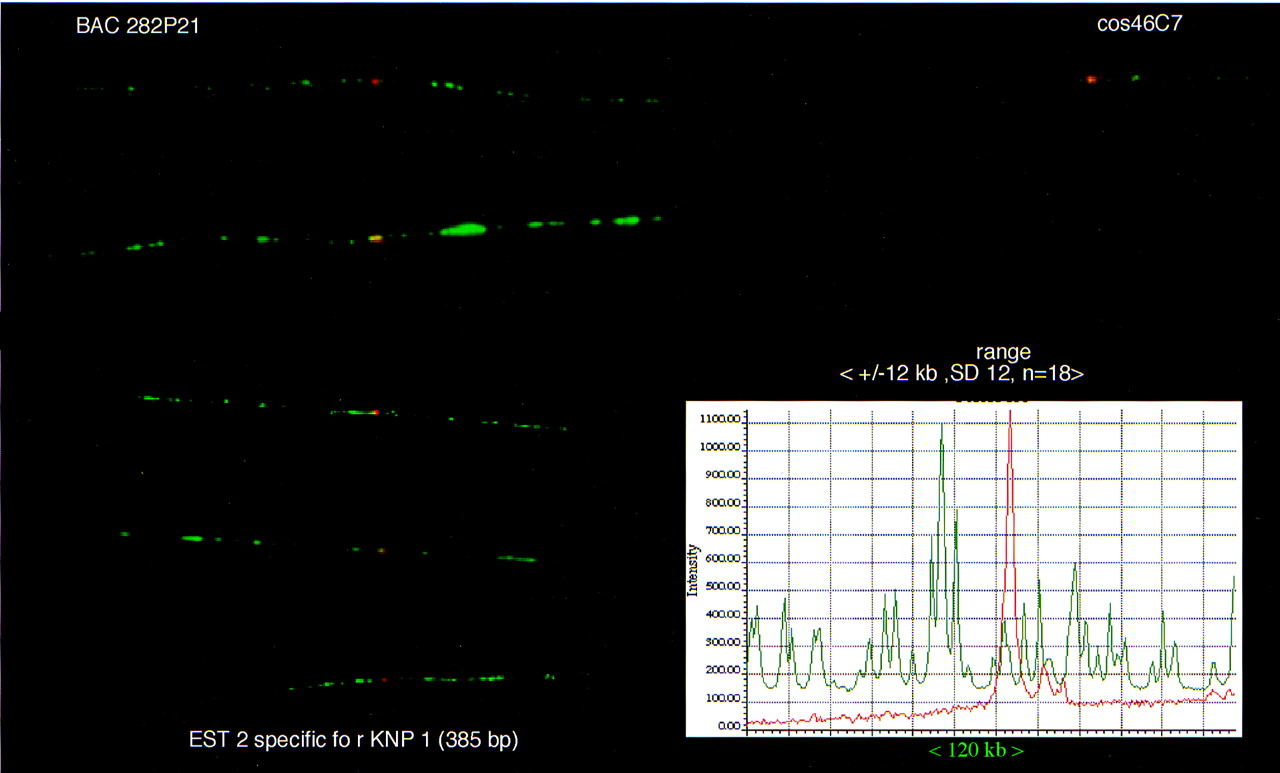
Figure 3.
An illustration of the reproducibility of mapping EST on free DNA fibers. The EST (EST 2) (red signal) specific for the KNP1gene was assigned on the BAC clone 282P21 in relation to an orientation marker (cos 46C7). The images represent four consecutive hybridizations. The variation in the position of an EST was determined to be ±12 kb with a s.d. of 12 on top of a long-range clone. The histogram (right) shows the precise location of the EST as a red peak of the intensity.


