
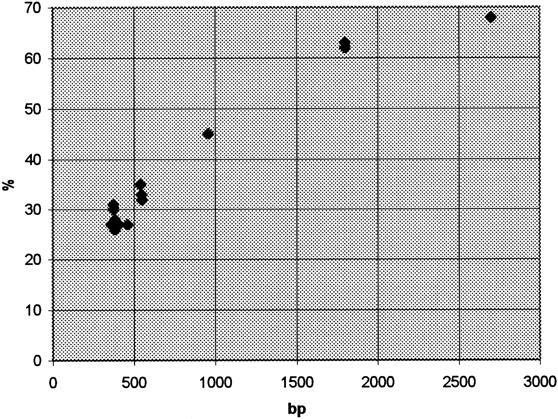
Figure 2.
A demonstration of the hybridization frequency when amplified EST fragments are hybridized to free DNA fibers and visualized by sensitive tyramide-based detection method. The hybridization frequency (y) clearly increases along with the increased probe size (x). (♦) Hybridization frequency of one EST or cDNA clone (see also Table2).


