
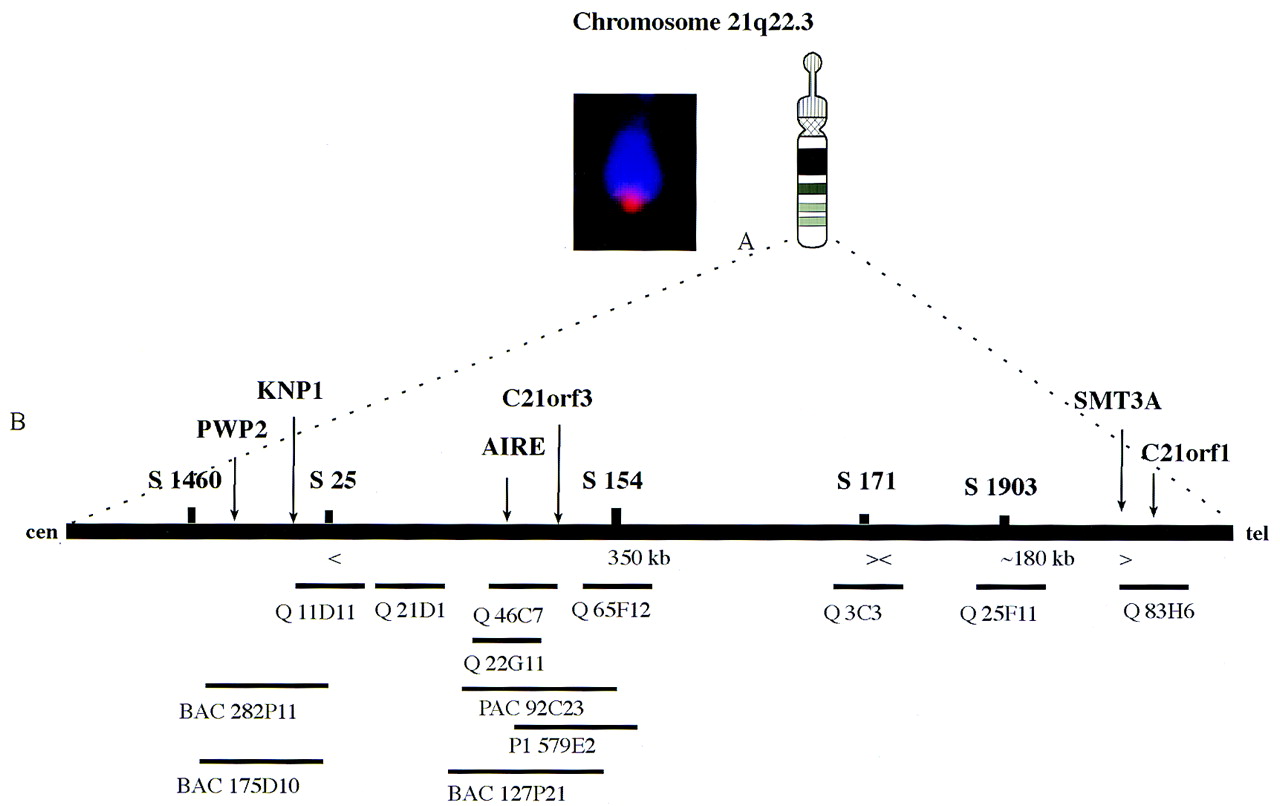
Figure 1.
(A) A metaphase chromosome showing a specific hybridization signal of an amplified EST fragment detected by tyramide-based detection (left) and an idiogram of the chromosome 21 (right). (B) A schematic representation of the critical genome region including the markers D21S1460 and D21S1903 on the chromosome 21q22.3. The locations of the genes of interest are positioned according to the known markers and to the clone contig established earlier (Aaltonen et al. 1997a). Symbols above the long solid bar represent polymorphic markers. The short horizontal bars represent clones where Q stands for cosmid clones.


