
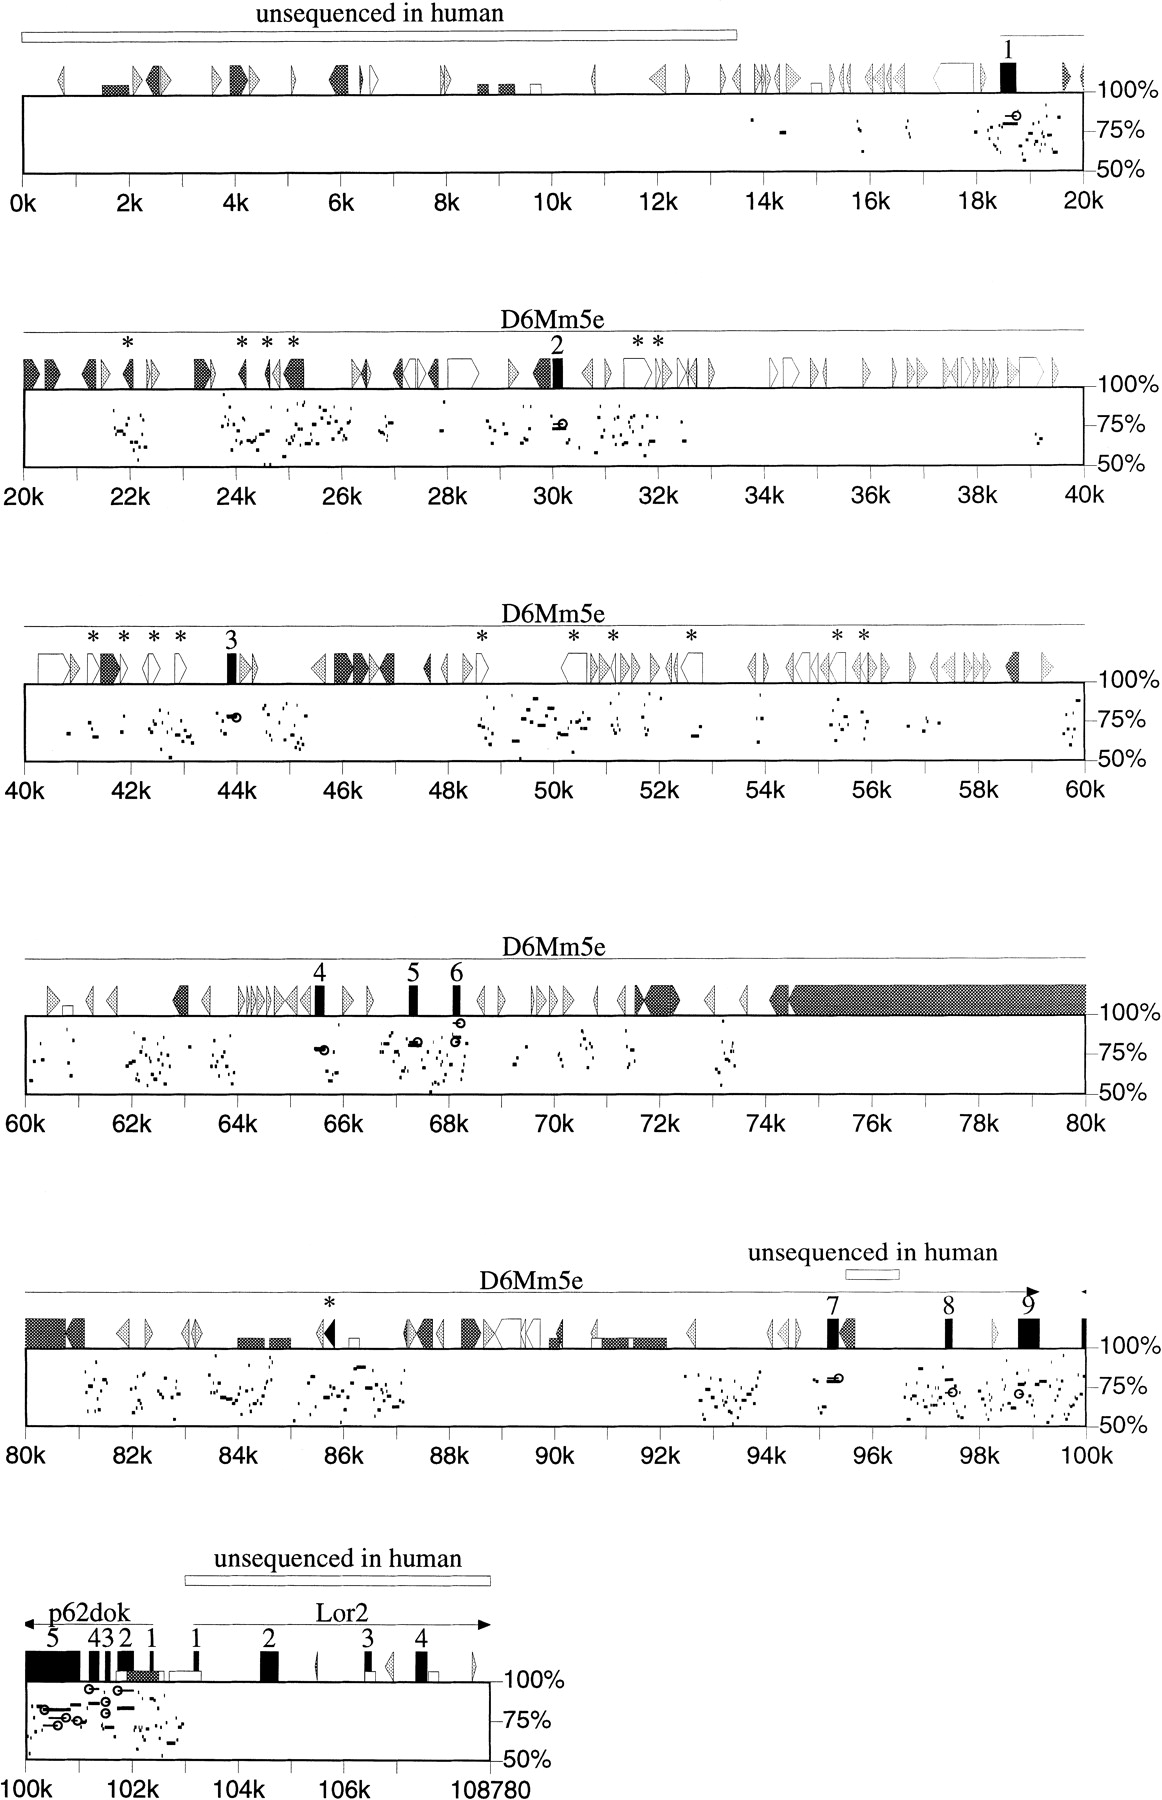
PIP of aligned mouse and human BAC sequences. The nucleotide position of the mouse sequence is shown on the horizontal axis and the percent identity of the nongapped alignment between mouse and human sequence in the range between 50% and 100% is plotted in the vertical axis. The length of the horizontal line indicates the size of the nongapped alignment. Lollipop symbols mark open reading frames that satisfy the criteria described in the text. (Numbered black boxes) Exons; (open arrows) LINE 1; (black triangles) MIR; (light gray triangle) SINEs other than MIR; (dark gray triangle) other interspersed repeats. Interspersed repeats that appear to have inserted prior to the divergence of human and mouse are marked with asterisks. CpG islands in the mouse sequence are represented by short boxes: (open) CpG/GpC ⩾ 0.6; (dark gray) CpG/GpC ⩾ 0.75.


