
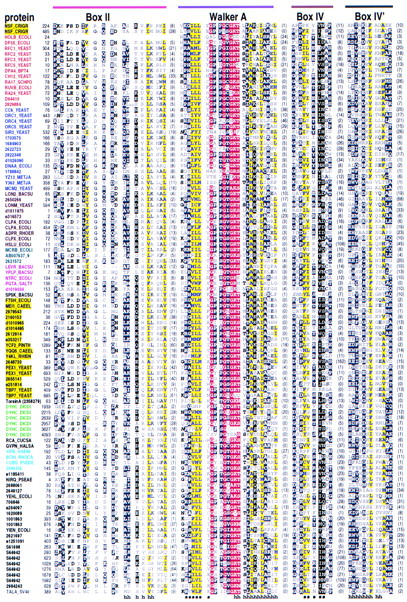
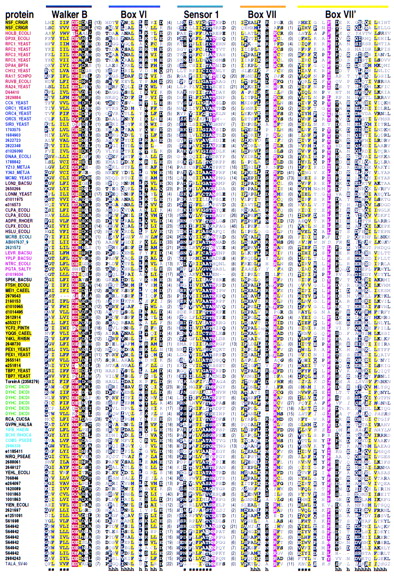
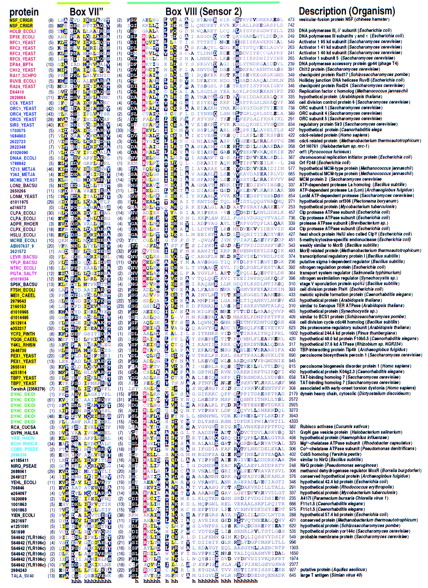
Representative multiple sequence alignment of AAA+ proteins. The NSF (NSF_CRIGR, residues 485–742) and Pol III δ′ (HOLB_ECOLI) sequences, whose structures are known, are given at the top. Sequences are grouped into families by the following color scheme: (Red) RFC and related proteins; (blue) MCMs, ORC, and Cdc6 proteins; (brown) Lon and Clp family; (teal) McrB-related proteins; (magenta) NtrC family; (yellow) AAA family; (green) dynein; (cyan) Mg2+and Co2+ chelatases; (gray) SV40 large T-antigen helicase; (black) others. Segments in individual sequences that are no more conserved than expected by chance are italicized. For each aligned column, conserved residues [i.e., elevated with binomial tail probabilities ≤ 0.01 (Neuwald and Green 1994)] and related, marginally conserved residues (with tail probabilities ≤ 0.05) are indicated using the following automated hierarchical scheme: (red highlight) ⩾2.5 bits of information; (magenta highlight) 1.8–2.5 bits of information; (yellow highlight) ⩾70% hydrophobic; (black highlight) >66% conserved; (dark gray highlight) 50%–66% conserved; (black) 33%–50% conserved; (dark gray) <33% conserved; (light gray) unconserved. Information is defined as the relative entropy of observed to background residue frequencies. The numbers of observed residues used in the relative entropy calculation were weighted by the method of Henikoff and Henikoff (1994). Related residues are defined by positive blosum62 pairwise scores (Henikoff and Henikoff 1992). Colored bars at the top correspond to the color scheme used in Fig. 2. Structural predictions are shown below the alignment. (h) Helix; (s) strand.


