
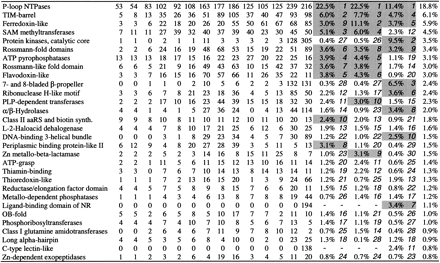
Table 3.
Top 30 Folds in Complete Proteomes
| Fold | Mg | Mp | Bb | Aa | Hp | Hi | Ss | Bs | Ec | Mj | Mt | Af | Sc | Ce | B | A | E | All |
|
||||||||||||||||||
-
The number of proteins in which the given fold was recognized is indicated for each proteome. Average percentage relative to the number of proteins with predicted folds is indicated for each superkingdom; cells for top 10 folds are shaded. The folds are sorted by overall rank.
-
↵Average fraction and rank in the given superkingdom
-
↵Average fraction among the three superkingdoms.


