
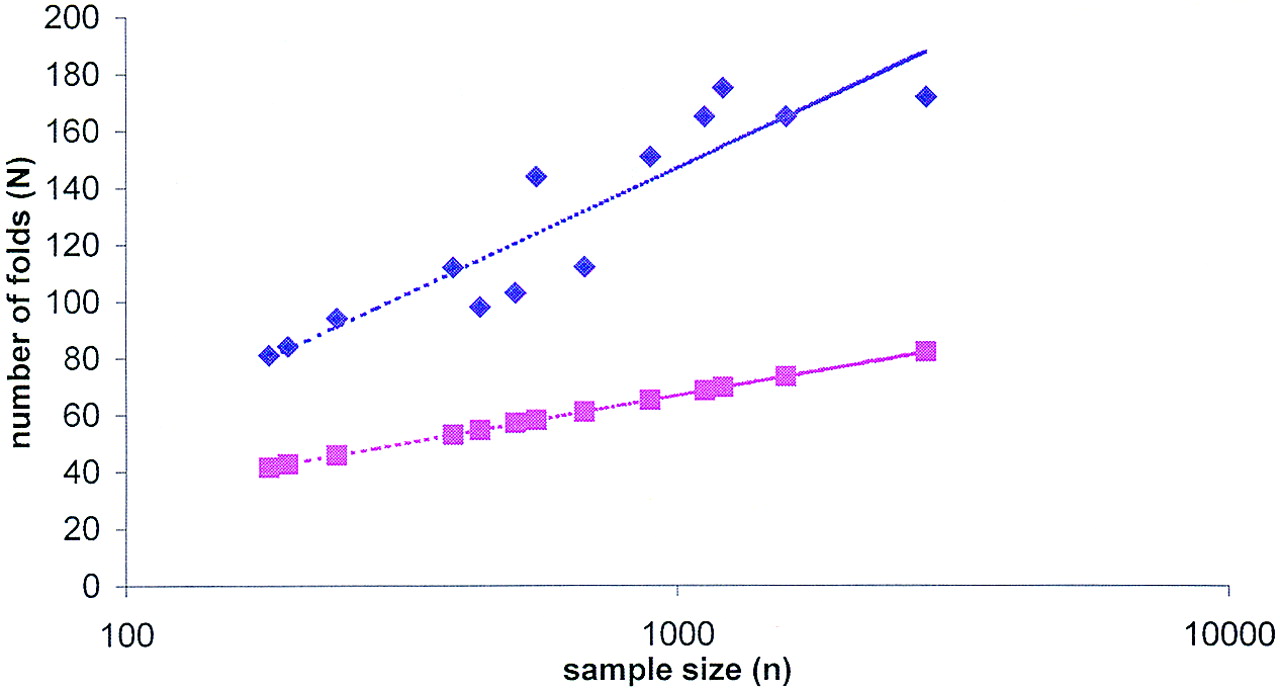
Figure 6.
Observed and simulated fold diversity in complete proteomes. (Blue diamonds) Observed number of different folds in the proteomes, plotted against the number of proteins with predicted folds (sample size). (Magenta squares) The results of computer simulations under the stochastic model (see text). (Dotted lines) The respective best-fitting logarithm approximations.


