
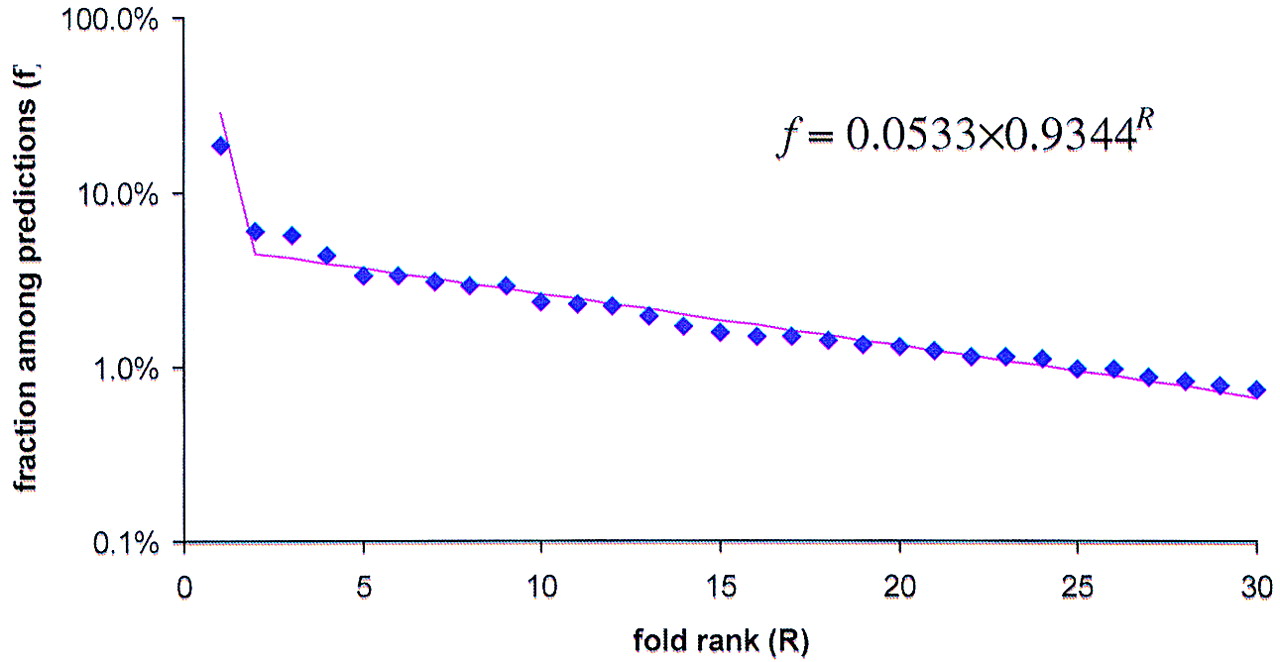
Figure 5.
Rank distribution of the unweighted average fraction of the top 30 protein folds in proteomes. (Blue diamonds) The observed unweighted average fractions of folds; (magenta line) The best-fitting exponent approximation.


