
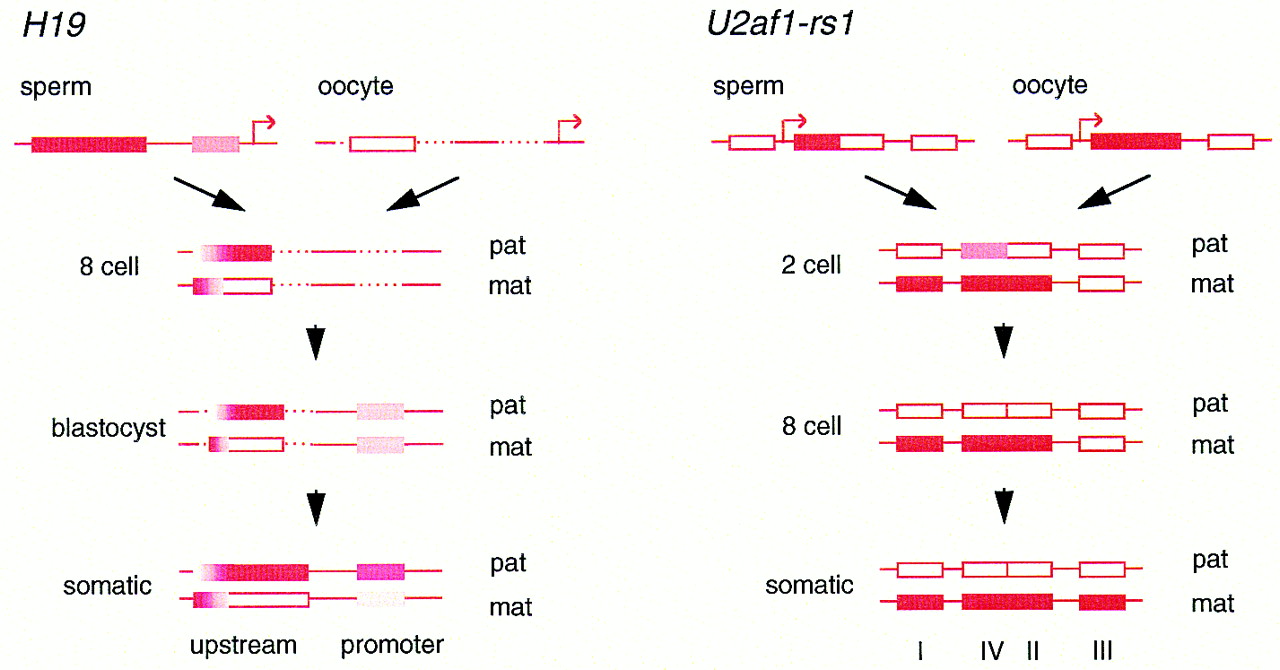
The ontogeny of allelic methylation at the H19 andU2af1-rs1 genes. (Solid bars) Complete methylation (>90%); (open bars) absence of methylation (<10%); (shaded bars) intermediate levels. Dashed lines represent regions not analyzed at the indicated stages. The locations of the transcription start sites are indicated by the arrows in the top line (which are not intended to represent actual expression status). The scheme forH19 represents a composite of two bisulfite genomic sequencing studies (Olek and Walter 1997; Tremblay et al. 1997). The upstream differentially methylated region comprises 59 CpG dinucleotides, of which 27 were assayed in oocytes and eight-cell embryos (Olek and Walter 1997) and 14 in blastocysts (Tremblay et al. 1997); the promoter proximal region comprises 9 CpG dinucleotides. The methylation of maternal and paternal alleles in two-cell embryos did not differ from the gametes in the regions analyzed (Olek and Walter 1997). The scheme for U2af1-rs1 derives from a PCR analysis of the methylation of restriction sites by Shibata et al. (1997). Each region contains multiple sites for HpaII and HhaI. Therefore, precise levels of methylation at individual sites cannot be inferred. Methylation at the one-cell stage did not differ from the gametes.


