
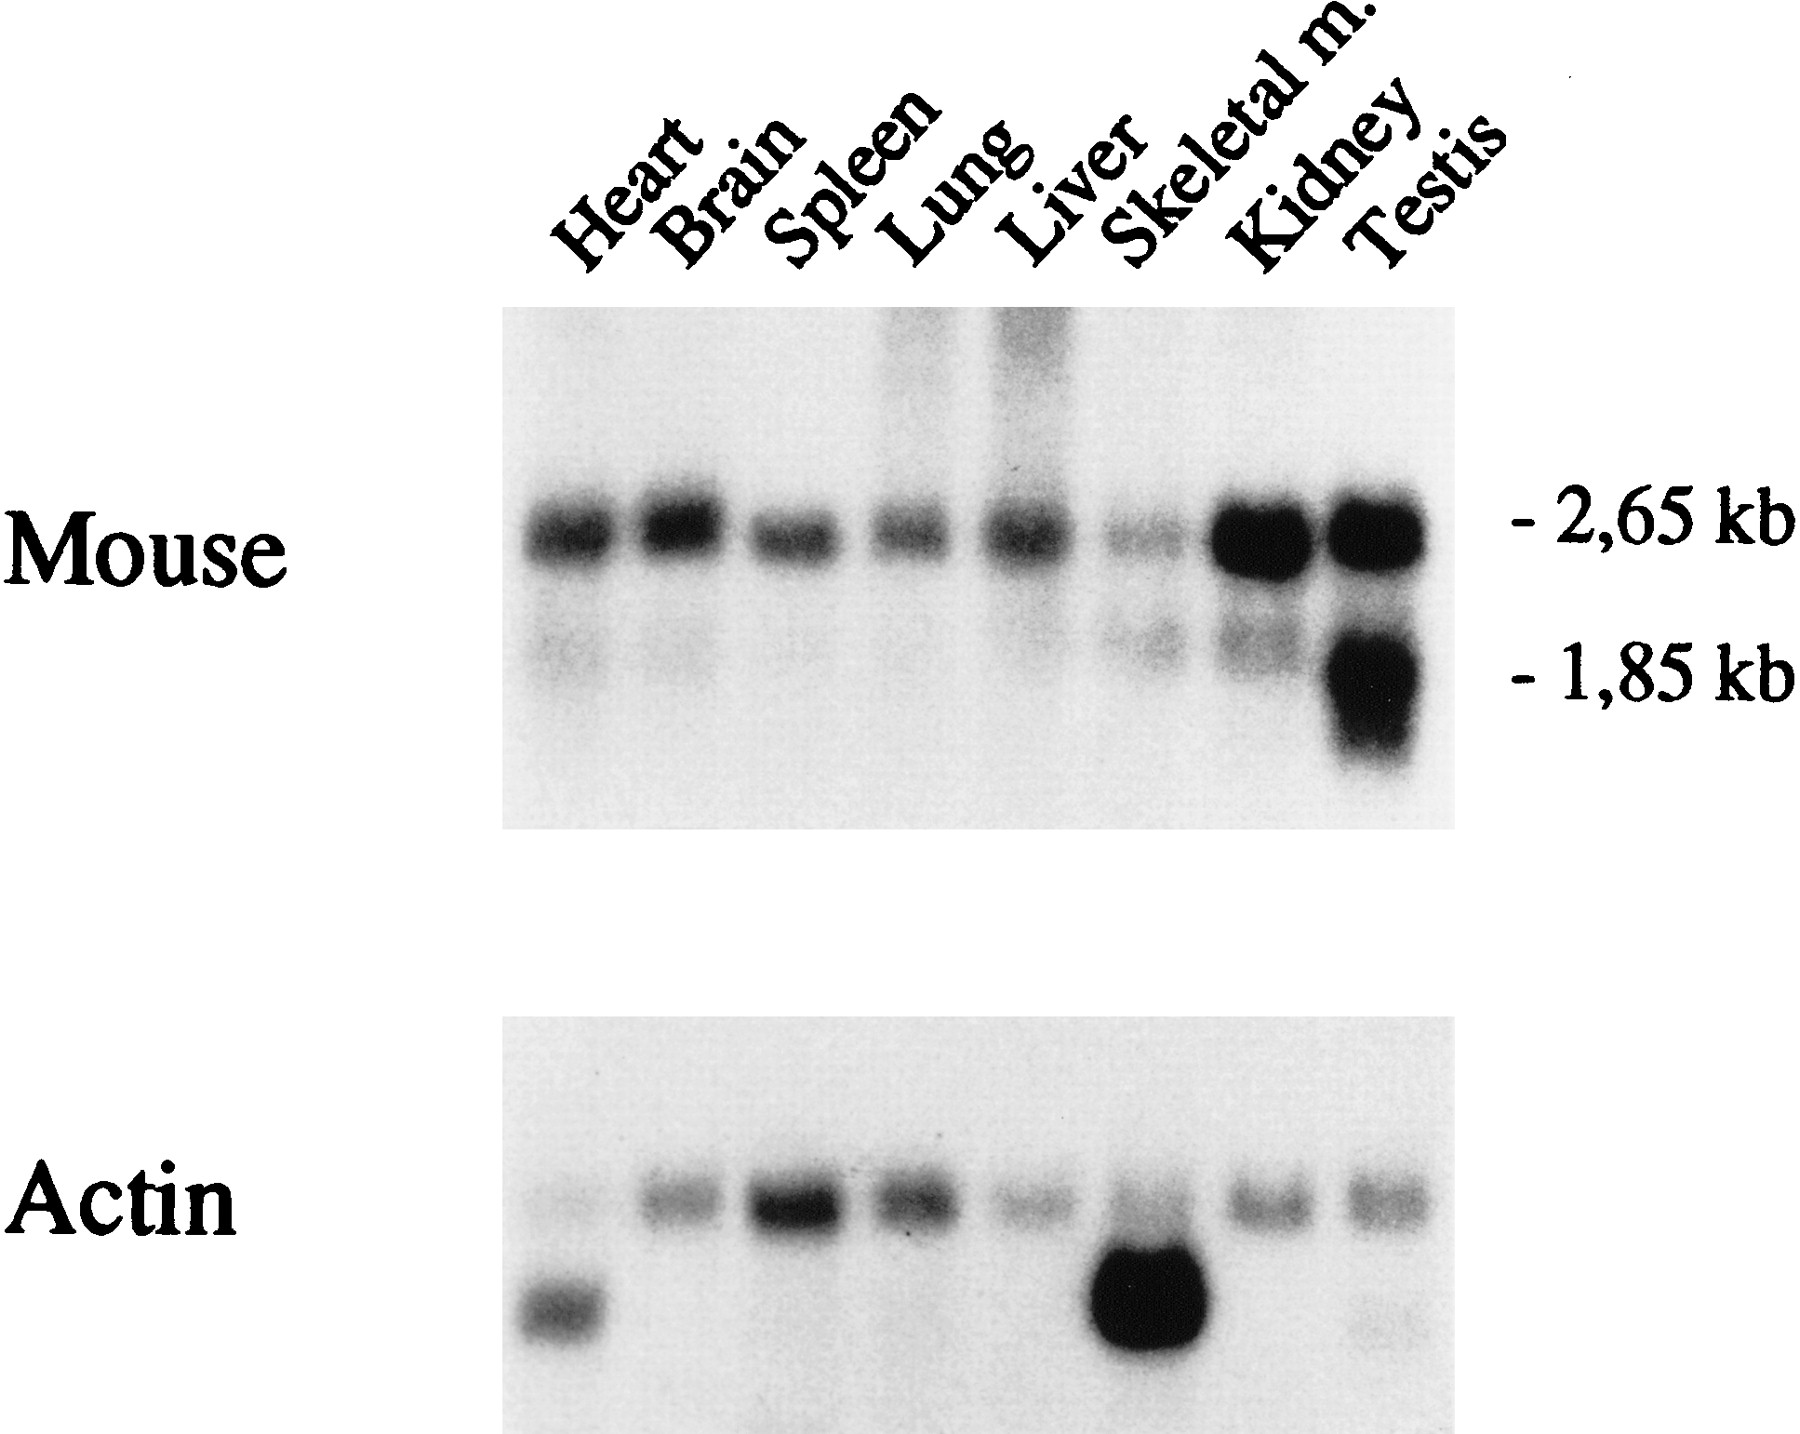
Figure 4.
Northern blot analysis of PPT mRNA in different mouse tissues. (Lane 1) Heart; (lane 2) brain; (lane 3) spleen; (lane 4) lung; (lane 5) liver; (lane6) skeletal muscle; (lane 7) kidney; (lane8) testis. Sizes of the PPT transcripts are indicated. The filter was probed with 32P-labeledPPT cDNA. (Bottom) β-Actin control probe hybridized ot the same filter as used in top.


