
Abstract
Palmitoyl protein thioesterase (PPT) is the defective enzyme in infantile neuronal ceroid lipofuscinosis (INCL), which is a recessively inherited, progressive neurodegenerative disorder. We present here the cloning, chromosomal mapping, genomic structure, and the expression of the cDNA of mouse PPT. The mouse PPT gene spans >21 kb of genomic DNA and contains nine exons with a coding sequence of 918 bp. Fluorescence in situ hybridization to metaphase chromosomes localized the mouse PPT gene to the chromosome 4 conserved syntenic region with human chromosome 1p32 where the human PPTis located. PPT is expressed widely in a variety of mouse tissues. The mouse PPT cDNA is conserved highly with the human and rat PPT both at the nucleotide and amino acid sequence level. Transient expression of mouse PPT in COS-1 cells yielded a 38/36-kD differentially glycosylated polypeptide that was also secreted into culture media. Immunofluorescence analysis of transiently transfected HeLa cells indicated lysosomal localization of mouse PPT. Based on the high conservation of the gene and polypeptide structure as well as similar processing and intracellular localization, the function of PPT in mouse and human are likely to be very similar.
[The sequence data described in this paper have been submitted to GenBank under accession no. AF071O25.]
Infantile neuronal ceroid lipofuscinosis (INCL, CLN1) is an autosomal recessive neurodegenerative disorder of childhood. The incidence of INCL is 1:20,000, and the approximated carrier frequency is 1:70 in the Finnish population. INCL is characterized by ataxia, psychomotor retardation, early visual loss, and mental retardation and leads to a vegetative state by the age of 3 yr (Santavuori et al. 1974). The life expectancy of patients is ∼10 yr. The accumulation of ceroid and lipofuscin-like material can be observed in neurons and other cell types when analyzing the histopathological samples of patients (Rapola and Haltia 1973). Saposins A and D constitute the main protein components accumulating in these inclusions (Tyynelä et al. 1993). The characteristic feature in tissue pathology in INCL is the selective loss of neurons of neocortical origin. Brain stem and spinal cord are much less affected, explaining the maintenance of patients’ basic functions.
The INCL locus was initially localized to human chromosome 1p32 (Järvelä et al. 1991) and the gene coding palmitoyl protein thioesterase (PPT) was subsequently identified using positional cloning strategies (Vesa et al. 1995). PPT was originally purified from bovine brain based on its ability to remove palmitate from palmitoylated H-Ras in vitro (Camp and Hofmann 1993), but the natural substrate(s) for PPT is unknown. The human PPT cDNA has been cloned and characterized. PPT gene spans 25 kb and consists of nine exons. The cDNA sequence contains a coding region of 918 bp in addition to 5′ and 3′ untranslated regions. The PPT polypeptide contains 306 amino acid residues and is N-glycosylated with high-mannose-type oligosaccharides (Camp et al. 1994). The enzyme is targeted to lysosomes via the mannose 6-phosphate receptor-mediated pathway and therefore INCL disease has been classified recently as a lysosomal storage disease (Hellsten et al. 1996, Verkruyse and Hofmann 1996).
A mouse deficient in PPT generated by gene disruption would be a valuable tool to clarify the very special pathology of INCL focusing on the neocortical regions. Toward this goal we report the cloning and characterization of the mouse PPT gene and further, cloning, sequence analysis, and expression of the corresponding cDNA. The data indicate high conservation in the gene structure and chromosomal localization. Mouse PPT polypeptide is 84.6% homologous to human enzyme and is similarly processed and lysosomally targeted as its human counterpart.
RESULTS
Cloning and Analysis of the Mouse PPT Gene and cDNA
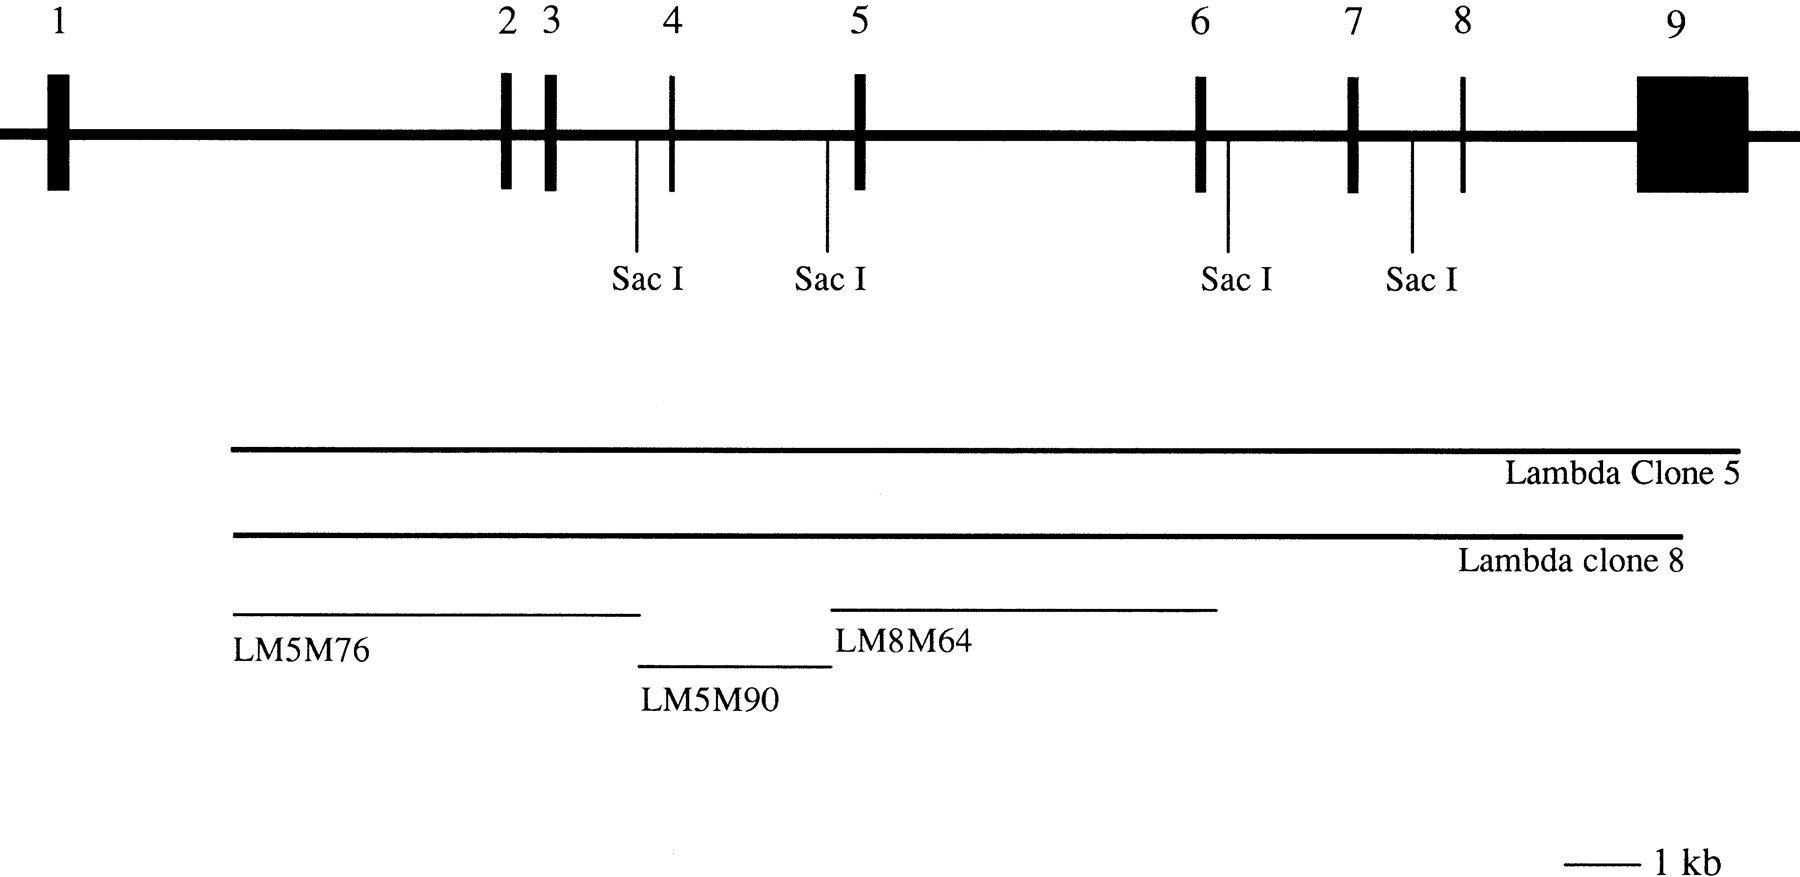
Mouse PPT genomic clones were isolated from a genomic library of mouse strain 129 SV in λ FIX II vector. After hybridizing with human PPT cDNA probe, two clones were isolated (Fig. 1), subcloned into pGEM4, and characterized in detail. Southern blot analysis with human PPTcDNA probes showed that λ clones contained sequence-encoding exons 2–8 but did not span exon 1. The exonic sequences of the genomic clones were obtained by initial sequencing with vector-specific primers as well as primers synthesized based on the human sequence.
Structure of the mouse PPT gene. Diagrammatic representation of the mouse PPT gene and the isolated λ clones (λM5 and λM8). Also the subclones LM5M76, LM5M90, and LM8M64 used for FISH are marked. Restriction sites for SacI are indicated on the map.
To confirm the predicted mouse PPT coding sequence and the positions of exon/intron boundaries, RT–PCR was performed on mouse liver and brain RNA with human exon 1-specific and mouse exon 8-specific primers. The single amplification product of 918 bp was sequenced, resulting in a cDNA with an open reading frame of 306 amino acids. Exon nucleotide sequences from the genomic clones were identical (all but one nucleotide: nucleotide 378 is A in mouse kidney cDNA and G in 129SV genomic DNA) to the RT–PCR cDNA sequence. The sequence of the 5′-end of exon 1 was further specified by sequencing a PCR product amplified from mouse cDNA kidney library with T7 and mouse PPT exon 4a primer.
Exon–intron boundaries were clarified by comparison of the mouse genomic sequence with mouse cDNA sequence from RT–PCR. The bidirectional sequencing of exons from genomic subclones using mouse PPT-specific primers gave ∼200 nucleotides of the intronic equences at the exon-intron boundaries. The size of each intron was determined by PCR using exon-specific primers (Fig. 1).
Chromosomal Localization
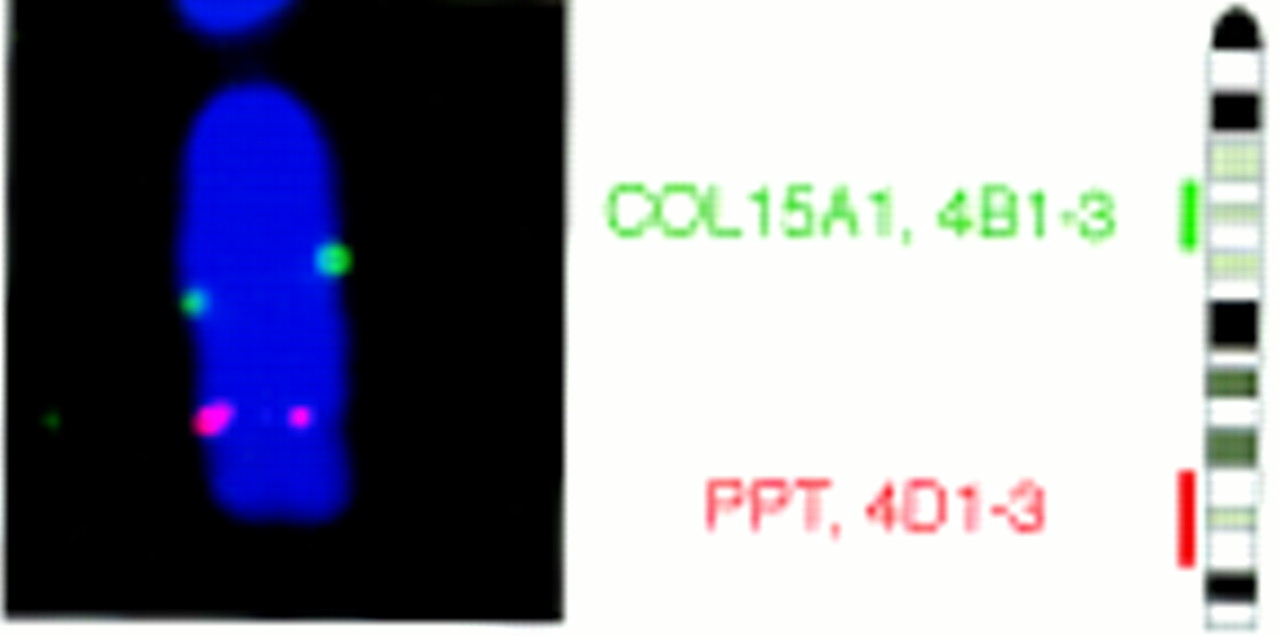
Mouse metaphase chromosomes were hybridized with genomic mouse PPT clones by parallel hybridization with a λ clone specific forCOL15A1 gene as a reference clone for mouse chromosome 4 (Hägg et al. 1997). The identification of the mouse chromosomes was based on their G-banding pattern (Cowell 1984) and parallel hybridization with the reference probe. The assignment of the mousePPT gene was based on specific hybridization signals on chromosome 4 band D1–3 (35 metaphases out of 40) with 80% hybridization efficiency (Fig. 2). Mouse chromosome 4, D1–3, is a syntenic region with human PPT gene assigned to chromosome 1p32.
FISH analysis of mouse metaphase chromosomes. FISH of the mousePPT gene. Examples of PPT signals (red) and COL15A1 (green) on mouse chromosome 4 both represent double-detected FISH signals and a diagrammatic illustration of FISH mapping data showing mousePPT on chromosome 4 band D1–3.
cDNA and Amino Acid Analysis
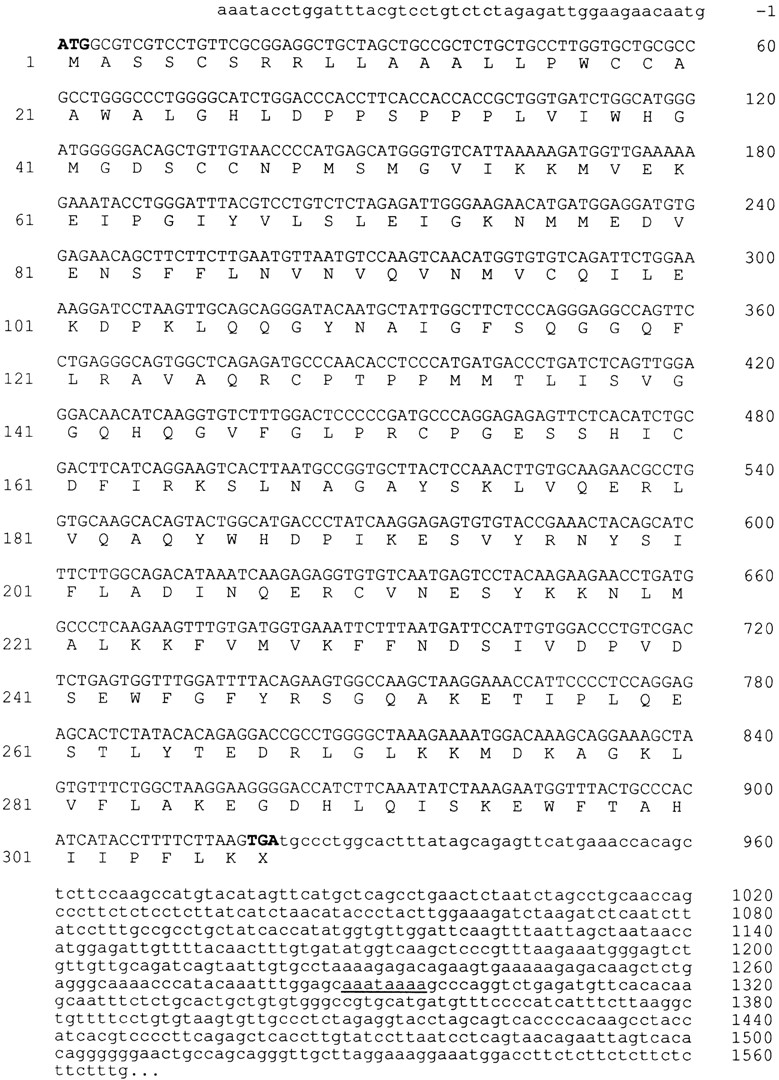
Comparison of the mouse versus human and rat cDNA sequences revealed that these genes display 84.3 and 94.1% identity at the nucleotide level (Fig. 3). Also a strong amino acid sequence homology was observed between the mouse and human (84.6% identity and 96.3% similarity) and between mouse and rat PPT (94.4% identity and 98.3% similarity). The identity between these amino acid sequences is 100% in the acyl-CoA thioesterase consensus sequence. Mouse PPT contained 46 bp of 5′-untranslated region, which was sequenced both from a PCR product of a mouse kidney cDNA library and from a 5′ RACE (not shown). Additionally, a 1.5-kb 3′-untranslated region could be detected by detected by PCR analysis from the mouse kidney cDNA library. Two putative polyadenylation signals were identified at positions 1288 and 2290.
The nucleotide sequence of mouse PPT cDNA. The open reading frame encoded by the gene is in uppercase letters. Nucleotide positions are at right. The amino acid sequence starting with initiator methionine is numbered at left. The first polyadenylation signal is underlined.
Analysis of RNA
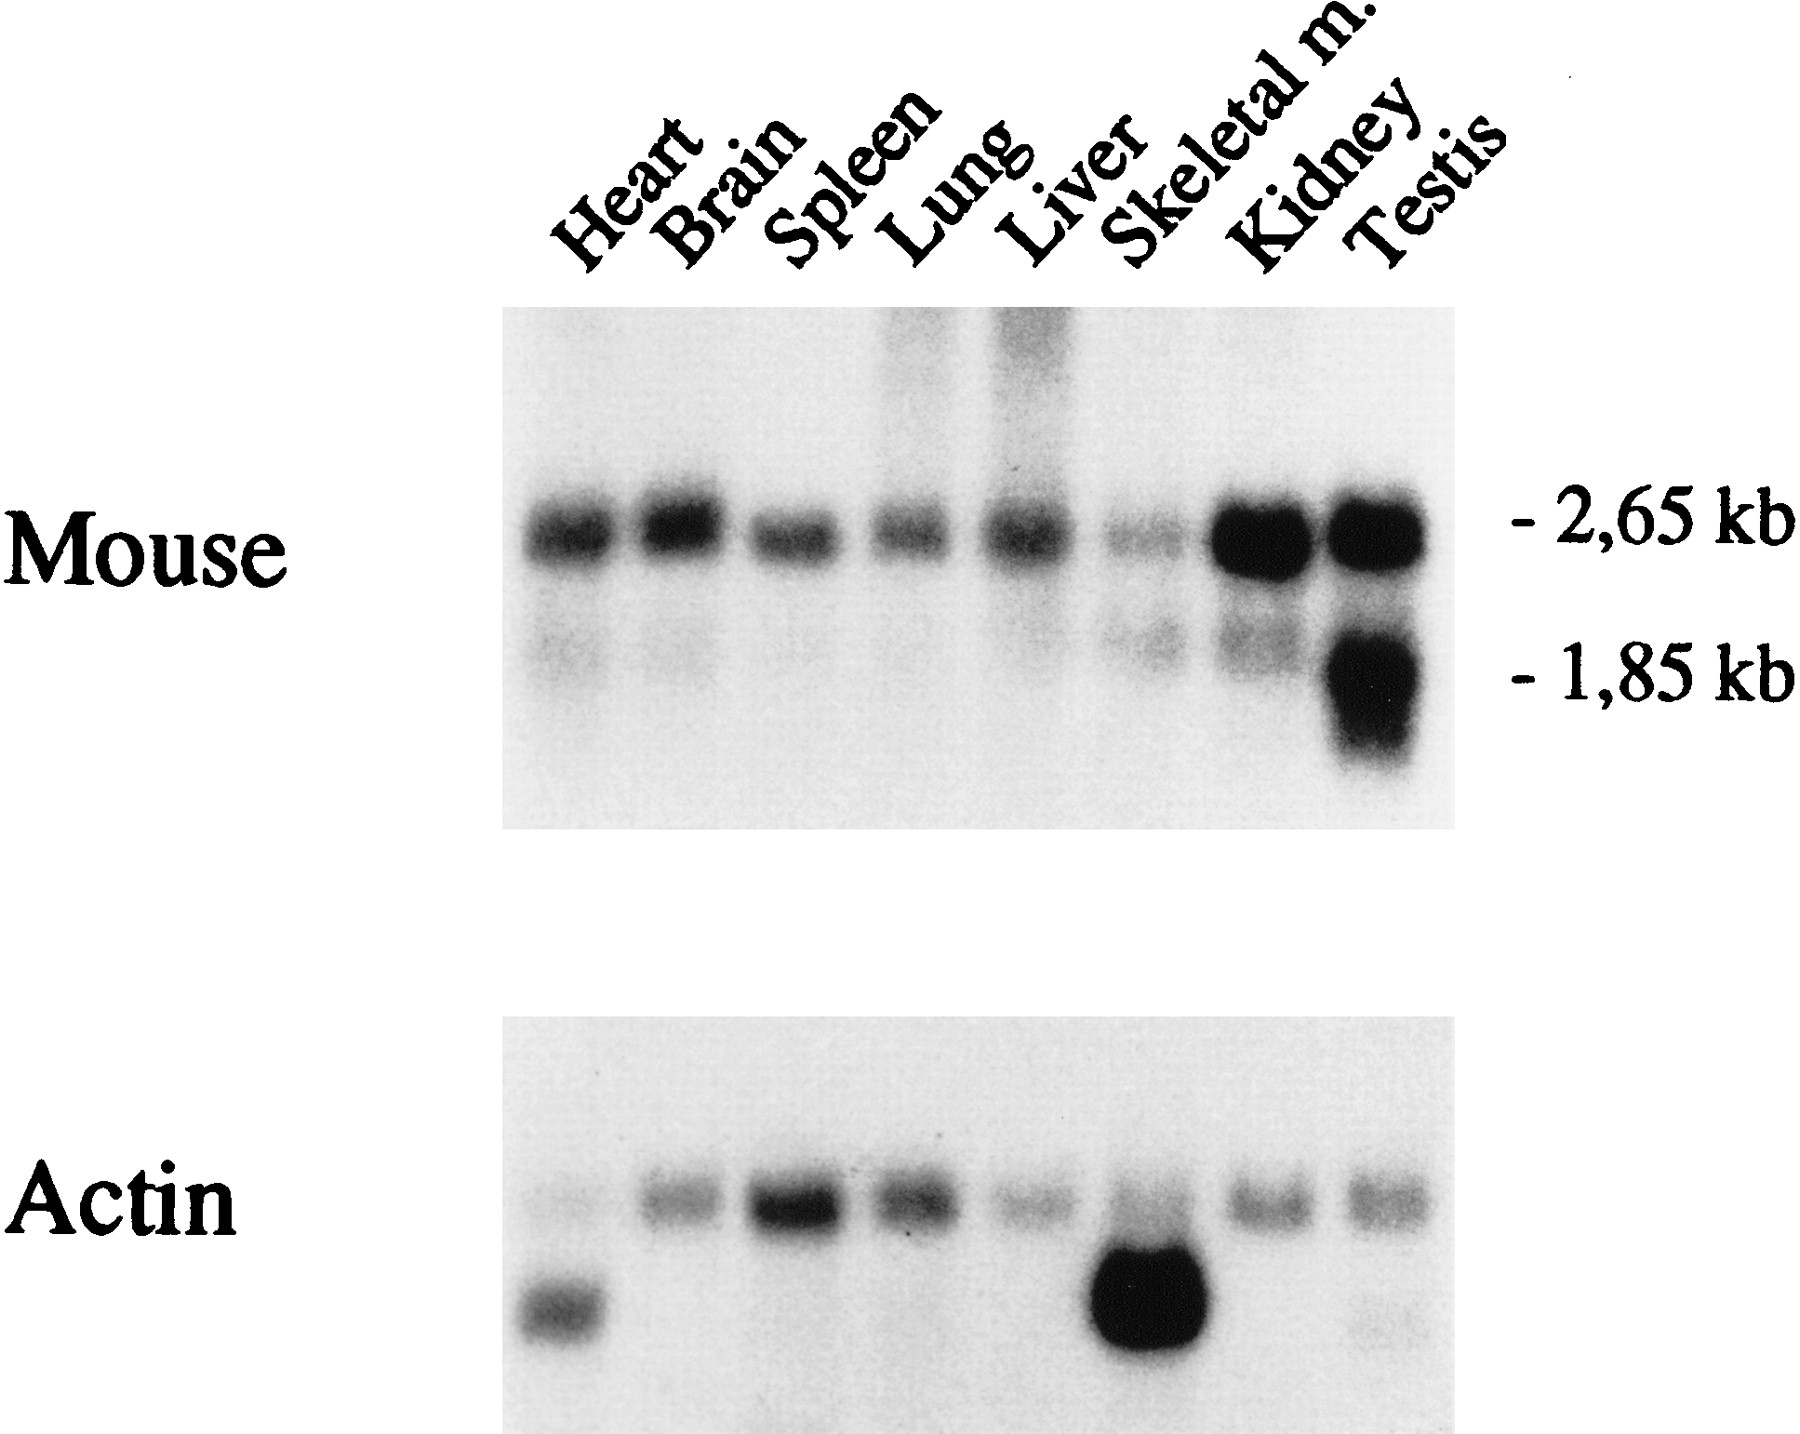
The presence of PPT mRNA was demonstrated by Northern blot analysis in eight tissues examined. Highest steady-state mRNA levels were detected in testis and kidney. Heart, brain, spleen, lung, and liver showed lower, relatively similar mRNA levels, and the lowest level was found in skeletal muscle. The mouse PPT gives a major transcript of 2.65 kb and a smaller 1.85 kb transcription product when hybridized with a cDNA probe containing the coding region of mouse PPT (Fig. 4). Exceptionally to other tissues the 1.85-kb mRNA was the major transcript found in testis. The in vivo finding of two mRNAs supports the cDNA sequence data in which two putative polyadenylation sites 1 kb apart could be detected.
Northern blot analysis of PPT mRNA in different mouse tissues. (Lane 1) Heart; (lane 2) brain; (lane 3) spleen; (lane 4) lung; (lane 5) liver; (lane6) skeletal muscle; (lane 7) kidney; (lane8) testis. Sizes of the PPT transcripts are indicated. The filter was probed with 32P-labeledPPT cDNA. (Bottom) β-Actin control probe hybridized ot the same filter as used in top.
Intracellular Synthesis and Maturation of the Mouse PPT
To study the intracellular processing and transport of the mouse PPT enzyme, the cDNA was subcloned into the pCMV5 expression vector. Immediately after synthesis, mouse PPT could be detected as four bands of apparent molecular masses of 32, 34, 36, and 38 kD. Intracellular mouse PPT was processed to a 36/38-kD doublet mature form when chase time was extended to 2 hr. The enzyme was also detected extracellularly after a 2-hr chase period. In the media, mouse PPT was always found as a 36- and 38-kD doublet. As compared to fully mature human PPT (35/37 kD) the mouse enzyme seemed to migrate slightly more slowly on the SDS–polyacrylamide gels (Fig. 5A,B). The ratio between the extracellular and intracellular PPT polypeptides is approximately four times lower in mouse PPT than in human PPT. The extracellular PPT could be observed only when chase media contained 1% fetal calf serum, suggesting high sensitivity to proteolysis.
SDS-PAGE analysis of mouse and human PPT transfected in COS-1 cells and immunoprecipitated with anti-human PPT antibody. (A) Cells transfected with mouse PPT construct, pulse labeled for 1 hr and chased at 2, 5, and 24 hr. Both cells and media were immunoprecipitated. As a control cells transfected with a human PPT construct are shown atright. (B) Maturation of the intracellular mouse and human PPT polypeptides. One-hour pulse and 0-, 2-, and 5-hr chase. (C) Glycosidase digestions of the transfected cells after 20-min pulse, 1-hr chase, and immunoprecipitation. (−) Untreated; (E) Endo H; (P) PNGase F; (T) tunicamycin.
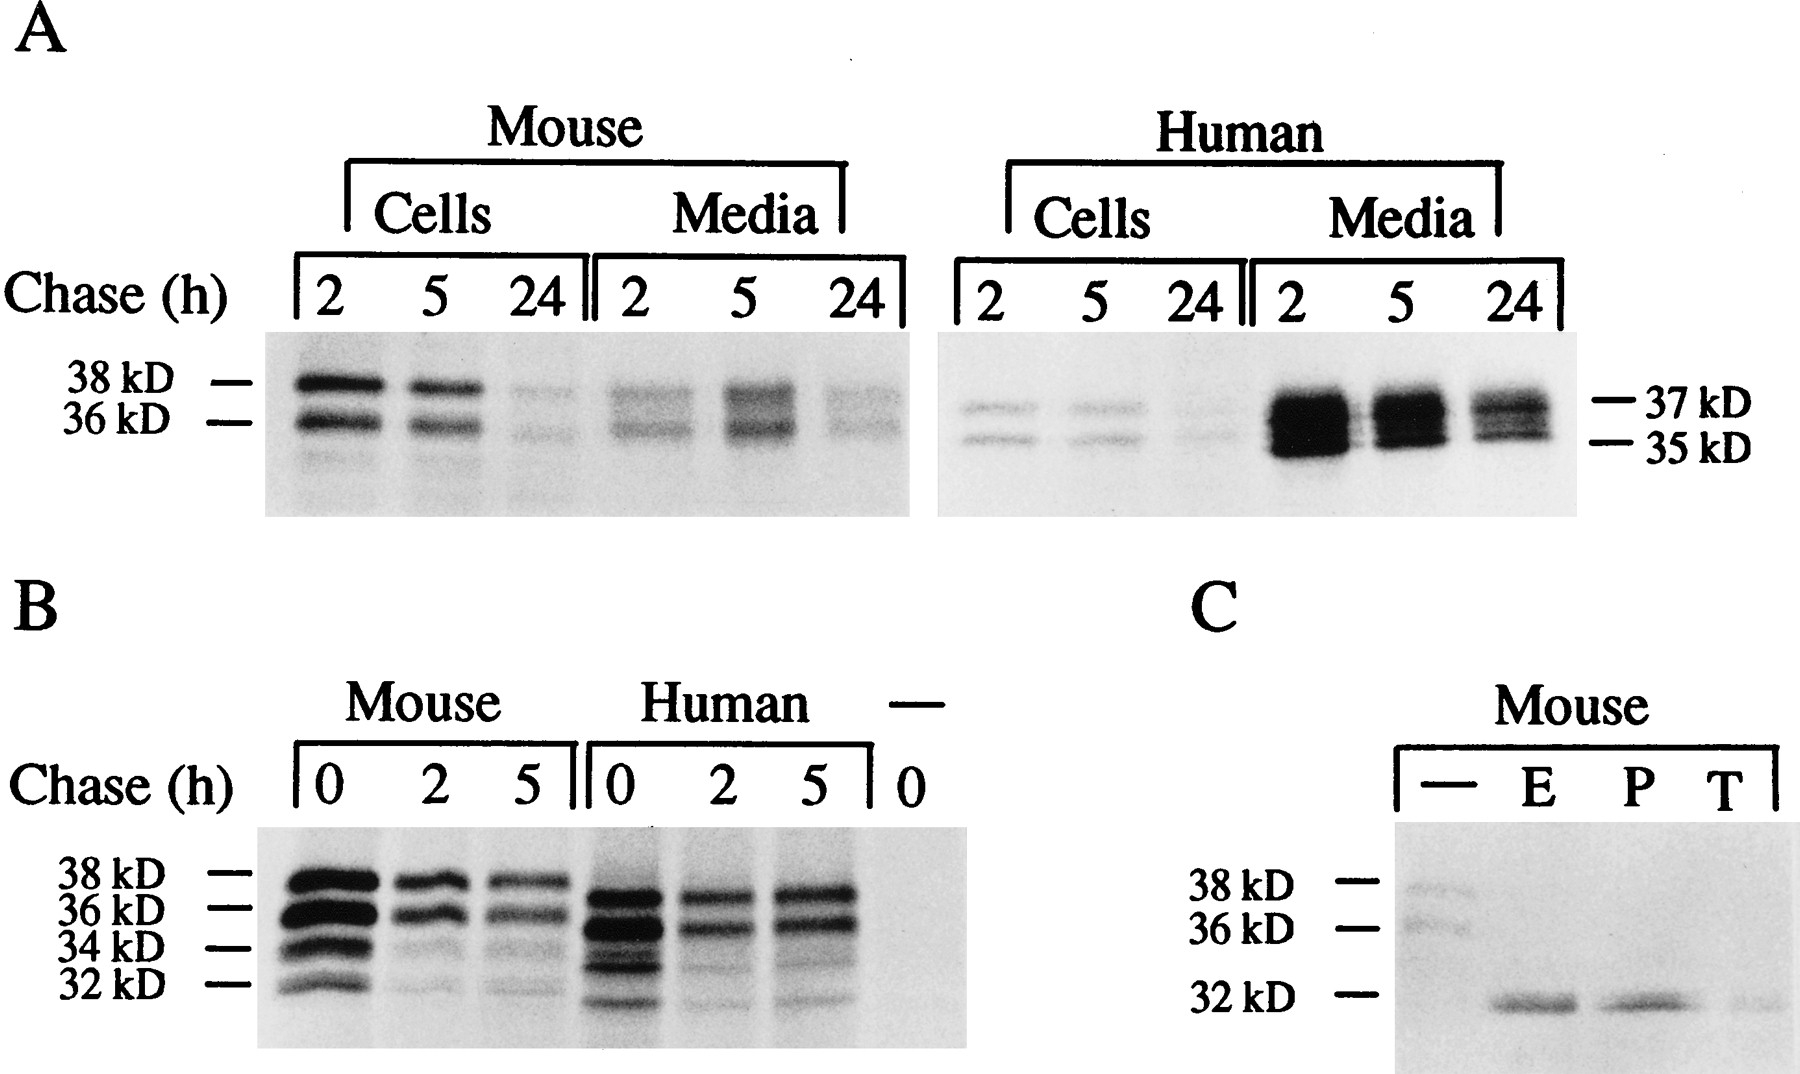
Mouse PPT has three putative N-glycosylation sites based on computer analysis with GCG:s Peptidestructure program. To analyze this post-translational processing of PPT, glycosidase digestions were performed. Treatment with PNGase F or Endo H or addition of tunicamycin to the culture media yielded a single 32-kD mouse polypeptide, indicating that the different polypeptide forms are caused by differential glycosylation (Fig. 5). The Endo H sensitivity further indicates that mouse PPT does not contain complex-type sugars. After deglycosylation, mouse PPT migrated slightly more slowly than human PPT, most probably because of differences in amino acid composition.
Intracellular Localization of Mouse PPT
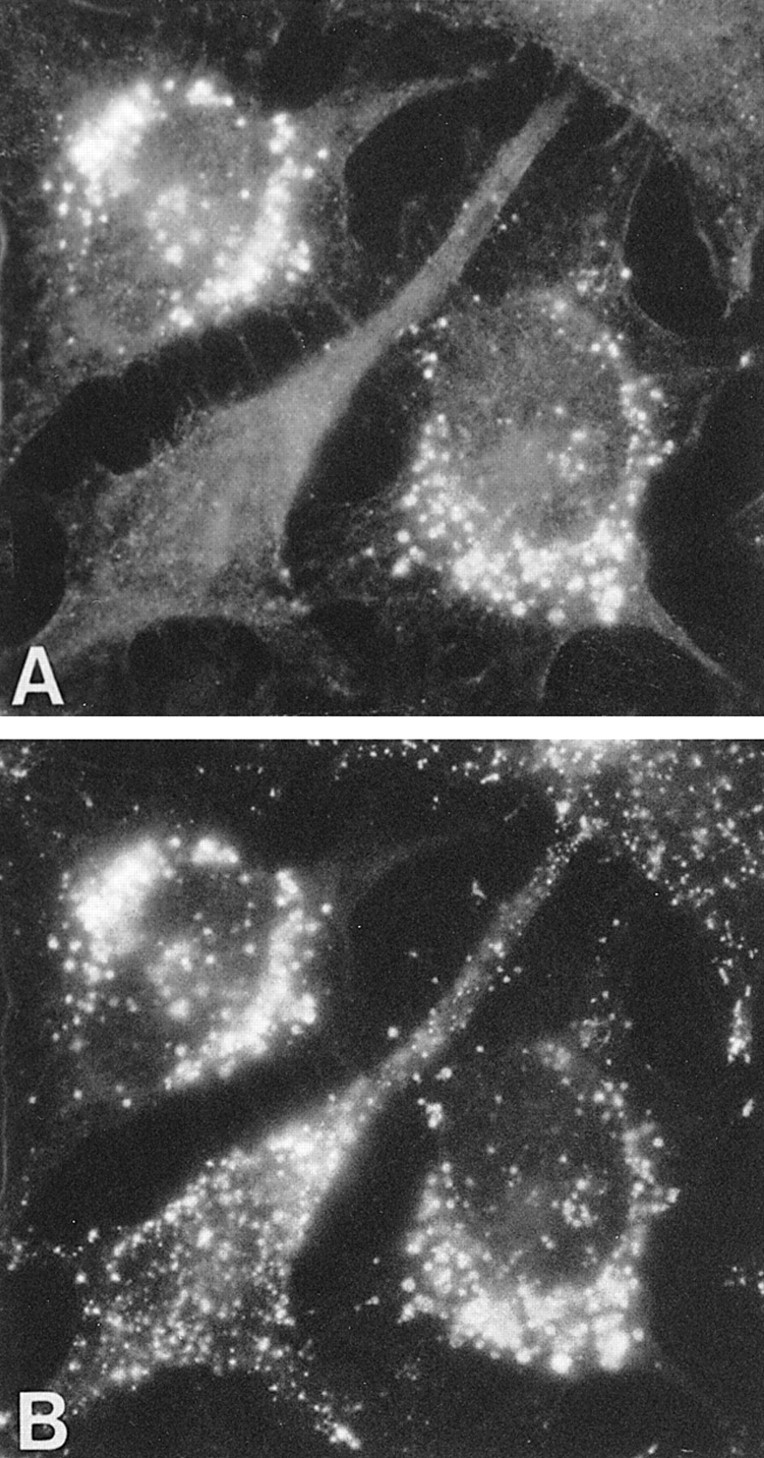
For immunofluorescence analysis of intracellular mouse PPT, transient transfections were performed in HeLa cells, in which the pCMV5 vector is not replicated into a high-copy plasmid. In HeLa cells, the expressed PPT was detected with rabbit polyclonal anti-human PPT and TRITC-conjugated anti-rabbit IgG antibodies, whereas the lysosomal marker lamp 1 was detected with mouse monoclonal lamp 1 antibody and FITC-conjugated anti-mouse IgG (Fig. 6). The perinuclear punctate staining pattern colocalized with the lysosomal lamp 1 marker, indicating that like its human counterpart, mouse PPT is a lysosomal enzyme.
Intracellular localization of mouse PPT by immunofluorescence analysis. HeLa cells were transfected with mouse PPT cDNA and simultaneously stained with human PPT and endogenous lamp 1 antibodies. (A) Anti-human PPT antibody and TRITC-conjugated anti-rabbit IgG. (B) Lamp 1 antibody and FITC-conjugated anti-mouse IgG. In A, two PPT-transfected cells can be seen and the untransfected cell in the middle represents background staining.
DISCUSSION
PPT seems to have a fundamental importance in the normal postnatal development and maturation of human neurons. The deficiency of PPT leads to the severe neurodegenerative children’s disorder, INCL (Vesa et al. 1996). The striking neuropathological finding in this disease is the complete loss of cortical neurons. Currently the natural substrate for PPT is not known and the disease mechanism remains unresolved. Toward the goal of understanding the functional inportance of this enzyme, we have analyzed previously the intracellular synthesis and localization of the human PPT and shown that PPT is a lysosomal enzyme (Hellsten et al. 1996). The next step in the analysis of the disease is the analysis of the mouse homolog of PPT, which offers the opportunity to create an animal model for the disease in which the brain pathology can be studied directly.
The mouse PPT gene consists of nine exons spanning 21 kb of genomic DNA. The human PPT gene also has nine exons, but spans >26 kb because of the larger sizes of the introns (Schriner et al. 1996). The exon–intron boundaries are located at exactly the same positions. Isolation of the mouse genomic DNA allowed us to identify the chromosomal localization at chromosome 4D1–3, which is a region syntenic to human chromosome 1p32, where the human PPT gene has been localized (Järvelä et al. 1991). No evidence for a mouse pseudogene or another locus could be identified. The coding region of mouse PPT is highly homologous to human and rat PPT (96.3% similarity between mouse and human and 98.3% similarity between mouse and rat). No significant homology can be found in the untranslated 5′ or 3′ regions, suggesting that they would not have significant regulatory roles. As expected, the degree of homology between mouse, rat, and human PPT is highest in the characteristic thioesterase region: 100% similarity can be observed in these sequences.
Northern analysis revealed two differentially polyadenylated mouse PPT-specific transcripts of 2.65 and 1.85 kb in several analyzed mouse tissues. The mRNA levels are quite equal in different tissues, except in testis and kidney, in which the transcript levels were clearly higher. The steady-state mRNA levels do not correlate very well to rat PPT (Camp et al. 1994), except for skeletal muscle in which the lowest mRNA levels are found in both species. In each tissue except testis, the longer mRNA is more abundant, reflecting the fact that the polyadenylation site located at the end of the 1.5 kb 3′-untranslated region seems to be more efficiently utilized. The wide tissue expression of PPT both in mouse and humans (Schriner et al. 1996) would indicate a housekeeping role for this enzyme. On the other hand, the deficiency of PPT in INCL disease suggests a brain-specific substrate for this enzyme. In each case, profound analyses containing the tissue expression versus function ofPPT still await completion.
Transient expression studies of mouse PPT in COS-1 cells indicated that the intracellular PPT is processed to mature 36/38-kD differentially glycosylated forms, is targeted lysosomally, and is partially secreted. Actually, the amount of secreted mouse PPT was clearly smaller than in the case of human PPT, because extracellular mouse PPT seems to be more sensitive to proteolytic degradation. This may indicate a more profound function for the lysosomal PPT than its extracellular counterpart. Many soluble lysosomal enzymes have been reported to be secreted, especially under the circumstances of overexpression (Ioannou et al. 1992). We have not been able to detect endogenous human or mouse PPT in the culture medium of fibroblasts, for example (not shown), but in this case even the endogenous intracellular enzyme is difficult to detect because of the low amounts present.
The gene and predicted polypeptide structure of PPT as well as highly similar intracellular processing and tissue expression suggest a similar function for the mouse and human enzyme. In the future a knockout mouse model will be valuable for the studies of the molecular pathogenesis of INCL as well as for treatment trials. One naturally occurring animal model for INCL has been proposed: a lamb showing a similar severe brain disease (Palmer et al. 1986). However, noPPT mutations have been reported in this animal model and it remains to be seen whether it represents INCL or a closely related disease. The NCL disease family actually consists of six related diseases (infantile, three types of late infantile, juvenile, and an adult form), of which three have been shown to be caused by a defect of a lysosomal protein (Hellsten et al. 1996; Järvelä et al. 1997; Sleat et al. 1997). Once all the defective genes have been clarified, this disease family will be an interesting tool to study the normal development of neurons. Considering the techniques used today, mouse homologs of these polypeptides will be of great importance because of the small size of these animals and fast crossbreeding times.
METHODS
Isolation of the Mouse PPT Gene
Genomic clones were isolated from a 129 SVJ mouse liver genomic library in λ FIX II vector (Stratagene). Approximately 1 × 10⁶ plaques were screened, using human PPTcDNA as a probe. Hybridization and washing conditions were performed according to standard procedures (Sambrook et al. 1989). Two clones were isolated and subcloned into the SacI site of the pGEM 4Z or into the EcoRI–HindIII and XbaI sites of pGEM 7Z. Subclones were sequenced using T7 and SP6 primers. Exon/intron boundaries and the sizes of introns were determined by PCR amplification of the genomic subclones using mouse PPT exonic primers to amplify the introns (Sambrook et al. 1989). All sequencing was performed by the dideoxy-chain termination method using T7 DNA polymerase (Sanger et al. 1977).
Fluorescence in Situ Hybridization
The cell culture from a mouse fetal tissue was established according to standard protocols (Fresney 1983) and used as a source for metaphase chromosomes. The chromosomal localization of the mousePPT gene was defined by fluorescence in situ hybridization (FISH) with a reference λ clone specific for the COL15A1gene (Hägg et al. 1997). To get a banding pattern on chromosomes, the cells were treated as described earlier (Tenhunen et al. 1995). The probes used to map PPT were a pool of three genomic subclones in pGEM4Z vectors (LM5M76, LM5M90, LM8M64; see Fig. 1) containing exons 2, 3, 4, and 5 with approximated sizes of 4.2; 2.2, and 4.0 kb.PPT genomic subclones were labeled with biotin–11-dUTP (Sigma Chemicals) and the COL15A1-specific λ clone with digoxigenin 11–dUTP (Boehringer Mannheim) by nick translation (Nick translation Reagent Kit, BRL) and detected as described elsewhere (Heiskanen et al. 1996).
RNA Analysis
Total RNA was isolated from mouse liver and brain tissues by the guanidium isothiocyanate/cesium chloride gradient method (Chirgwing et al. 1979) and used for RT–PCR analyses. Northern blot analysis was performed on Invitrogen multitissue blot filter. Hybridization with32P-labeled mouse cDNA was performed according to standard protocols (Sambrook et al. 1989). The Northern blot filter was reprobed with human β-actin to standardize the loading differences.
cDNA Cloning and Sequencing of the Mouse PPT
Two micrograms of the mouse liver and brain RNA was reverse transcribed with primer GTTCAGGCTGAGCATGAACTA (positions 1021–1000 on coding sequence). The cDNA was amplified by PCR with mouse-specific primers, one CAACCCAAGCTTAACAATGATGGCGTCGTCCT (positions −8 to 13) from the translation start site and another containing aHindIII site and TCCAACAAGCTTTCACTTAAGAAAAGGTATGATGT (positions 922–900) upstream from the translation termination codon containing aHindIII restriction enzyme site. The 921-bp-long PPTcDNA was purified with the PCR kit (Promega), cleaved byHindIII, and subcloned into the HindIII site of the pCMV5 (Andersson et al. 1989) vector for expression in COS-1 and HeLa cells. The complete nucleotide sequence analysis of the PCR-cloned mouse PPT cDNA was performed by the dideoxy-chain termination method using double-stranded DNA templates.
Isolation of the 5′-Untranslated Region and Exon 1
The 5′ end of the mouse genomic λ clone sequence appeared incomplete because of the absent exon 1 sequence. A sequence completing the 5′ region was accomplished by PCR reaction from the mouse kidney cDNA library (gift of Vesa Olkkonen, National Public Health Institute), using a mouse PPT exon 4-specific primer and a T7 primer from the library vector. The amplified, 600-bp DNA fragment was purified with a PCR purification kit (Promega) and sequenced bidirectionally.
Transfection, Labeling, and Immunoprecipitation
COS-1 and HeLa cell lines were grown in Dulbecco’s modified eagle medium (DMEM), supplemented with 10% fetal calf serum and antibiotics. One day prior to transfection, cells were seeded on six-well plates, 3.5 × 10⁵ cells per well. Transfection was performed with 5 μg of mPPT cDNA in pCMV5 vector, using the DEAE–dextran transfection method (Sussman and Millman 1984). Seventy-two hours post-transfection cells were pulse-labeled with [35S]cysteine (Amersham) for 1 hr. For deglycosylation, tunicamycin (5 μg/ml) was added 2 hr before labeling and was used at the same concentration throughout the labeling. Cells were pulse-labeled for 2, 5, and 24 hr. The medium and the cells were collected for immunoprecipitation, which was performed with polyclonal anti-human PPT antibody as described previously (Hellsten et al. 1996). Immunoprecipitated PPT was separated on 14% SDS–polyacrylamide gels (Laemmli 1970). Endo H and PNGase F digestions were performed overnight at 37°C as described previously (Tikkanen et al. 1995).
Immunofluorescence
For immunofluorescence staining the lipofectamine (GIBCO–BRL)-transfected (Felgner et al. 1987) HeLa cells were grown on 12-mm-diam. coverslips and fixed in methanol 72-hr after transfection. Cells were double stained with anti-human PPT antibody and monoclonal lamp 1 antibody (gift of Vesa Olkkonen); the secondary antibodies were TRITC-conjugated anti-rabbit IgG (Immunotech) for PPT and FITC-conjugated antimouse IgG (Immunotech) for lamp 1. The immunofluorescence staining was visualized under a Zeiss Axiophot immunofluorescence microscopy (magnification 630×).
We thank Tuula Airaksinen, Tuula Manninen, and Lea Puhakka for technical assistance. This study was financially supported by the Academy of Finland, the Finnish Cultural Foundation, the Hjelt Fond of the Pediatric Foundation, the Sigrid Juselius Foundation, and the Rinnekoti Research Foundation.
The publication costs of this article were defrayed in part by payment of page charges. This article must therefore be hereby marked “advertisement” in accordance with 18 USC section 1734 solely to indicate this fact.
Notes
[1] Present address: National Institutes of Health, Laboratory of Genetic Diseases Research, Bethesda, Maryland 20814 USA.
REFERENCES
- ↵S. AndersonD.L. DavisH. DahlbackH. JornvallD.W. Russell(1989) Cloning, structure and expression of the mitochondrial cytochrome P-450 sterol 26-hydroxylase, a bile acid biosynthetic enzyme. J. Biol. Chem. 264:8222–8229.
- ↵L.A. CampS.A. Hofmann(1993) Purification and properties of the palmitoyl-protein thioesterase that cleaves palmitate from H-Ras. J. Biol. Chem. 268:22566–22574.
- ↵L.A. CampL.A. VerkruyseS.K. AfendisC.A. SlaughterS.L. Hofmann(1994) Molecular cloning and expression of palmitoyl-protein thioesterase. J. Biol. Chem. 269:23212–23219.
- ↵J.M. ChirgwinA.E. PrzybalaR.J. MacdonaldW.J. Rutter(1979) Isolation of biologically active ribonucleic acid from sources enriched in ribonuclease. Biochemistry 18:5294–5299.
- ↵J.K. Cowell(1984) A photographic representation of the variability in the G-banded structure of the chromosomes in the mouse karyotype. Chromosoma (Berl.) 89:294–320.
- ↵P.L. FelgnerT.R. GadekM. HolmR. RomanH.W. ChanM. WenzJ.P. NorthropG.M. RingoldM. Danielsen(1987) Lipofection: A highly efficient, lipid-mediated DNA-transfection procedure. Proc. Natl. Acad. Sci. 84:7413–7417.
- ↵I.R. Fresney(1983) Culture of animal cells. Manual of basic technique (Allan R. Liss, New York, NY), p 265.
- ↵M. HeiskanenO.-P. KallioniemiA. Palotie(1996) Fiber-FISH: Experiences and a refined protocol. Genet. Anal. Biol. Eng. 12:179–184.
- ↵E. HellstenJ. VesaV.M. OlkkonenA. JalankoL. Peltonen(1996) Human palmitoyl protein thioesterase: Evidence for lysosomal targetting of the enzyme and disturbed cellular routing in infantile neuronal ceroid lipofuscinosis. EMBO J. 15:5240–5245.
- ↵Hägg, P.M., N.J. Horelli-Kuitunen, L. Eklund, A. Palotie, and T. Pihlajaniemi. 1997. Cloning of mouse type XV collagen sequences and mapping of the corresponding gene to 4B1-3. Genomics (in press)..
- ↵Y. IoannouD. BishopR. Desnick(1992) Overexpression of human alpha-galactosidase A results in its intracellular aggregation, crystallization in lysosomes and selective secretion. J. Cell Biol. 119:1137–1150.
- ↵I. JärveläJ. SchleutkerL. HaatajaP. SantavuoriL. PuhakkaT. ManninenA. PalotieL.A. SandkuijlM. RenlundR. WhiteP. AulaL. Peltonen(1991) Infantile form of neuronal ceroid lipofuscinosis (CLN 1) maps to the short arm of chromosome 1. Genomics 9:170–173.
- ↵Järvelä, I., M. Sainio, T. Rantamäki, V.M. Olkkonen, O. Carpen, L. Peltonen, and A. Jalanko. 1997. Biosynthesis and intracellular targetting of the CLN3 protein defective in Batten disease. Hum. Mol. Genet. (in press)..
- ↵U.K. Laemmli(1970) Cleavage of structural proteins during the assembly of the head of bacteriophage T4. Nature 227:680–685.
- ↵D.N. PalmerG. BarnsD.R. HusbandsR.D. Jolly(1986) Ceroid lipofuscinosis in sheep. J. Biol. Chem. 4:1773–1777.
- ↵J. RapolaM. Haltia(1973) Cytoplasmic inclusions in the veriform appendix and skeletal muscle in two types of so-called neuronal ceroid lipofuscinosis. Brain 96:833–840.
- ↵F. SangerS. NicklenA.R. Coulson(1997) DNA sequencing and chain-terminating inhibitors. Proc. Natl. Acad. Sci. 74:5463–5467.
- ↵J. SambrookE.F. FritschT. Maniatis(1989) Molecular cloning: A laboratory manual (Cold Spring Harbor Laboratory Press, Cold Spring Harbor, NY), 2nd ed..
- ↵P. SantavuoriM. HaltiaJ. Rapola(1974) Infantile type of so-called neuronal ceroid lipofuscinosis. Dev. Med. Child. Neurol. 16:644–653.
- ↵J.E. SchrinerW. YiS.L. Hofmann(1996) cDNA and genomic cloning of human palmitoyl-protein thioesterase (PPT), the enzyme defective in infantile neuronal ceroid lipofuscinosis. Genomics 34:317–322.
- ↵D.E. SleatR.J. DonnellyH. LacklandC.-G. LiuI. SoharR.K. PullarkatP. Lobel(1997) Association of mutations in a lysosomal protein with classical Late-Infantile Neuronal Ceroid Lipofuscinosis. Science 277:1802–1805.
- ↵D.J. SussmanG. Millman(1984) Short-term, high-efficiency expression of transfected DNA. Mol. Cell. Biol. 4:1641–1643.
- ↵K. TenhunenM. LaanT. ManninenA. PalotieL. PeltonenA. Jalanko(1995) Molecular cloning, chromosomal assignment, and expression of the mouse aspartylglucosaminidase gene. Genomics 30:244–250.
- ↵R. TikkanenN. EnomaaA. RiikonenE. IkonenL. Peltonen(1995) Intracellular sorting of aspartylglucosaminidase: The role of N-linked oligosaccharides and evidence of Man-6-P independent lysosomal targetting. DNA Cell. Biol. 14:305–312.
- ↵J. TyyneläD.N. PalmerM. BaumannM. Haltia(1993) Storage of saposins A and D in infantile neuronal ceroid lipofuscinosis. FEBS Lett. 330:8–12.
- ↵L.A. VerkruyseS.L. Hofmann(1996) Lysosomal targeting of palmitoyl-protein thioesterase. J. Biol. Chem. 28:15831–15836.
- ↵J. VesaE. HellsteinL.A. VerkruyseL.A. CampJ. RapolaP. SantavuoriS.L. HofmannL. Peltonen(1995) Mutations in the palmitoyl protein thioesterase gene causing infantile neuronal ceroid lipofuscinosis. Nature 376:584–587.