
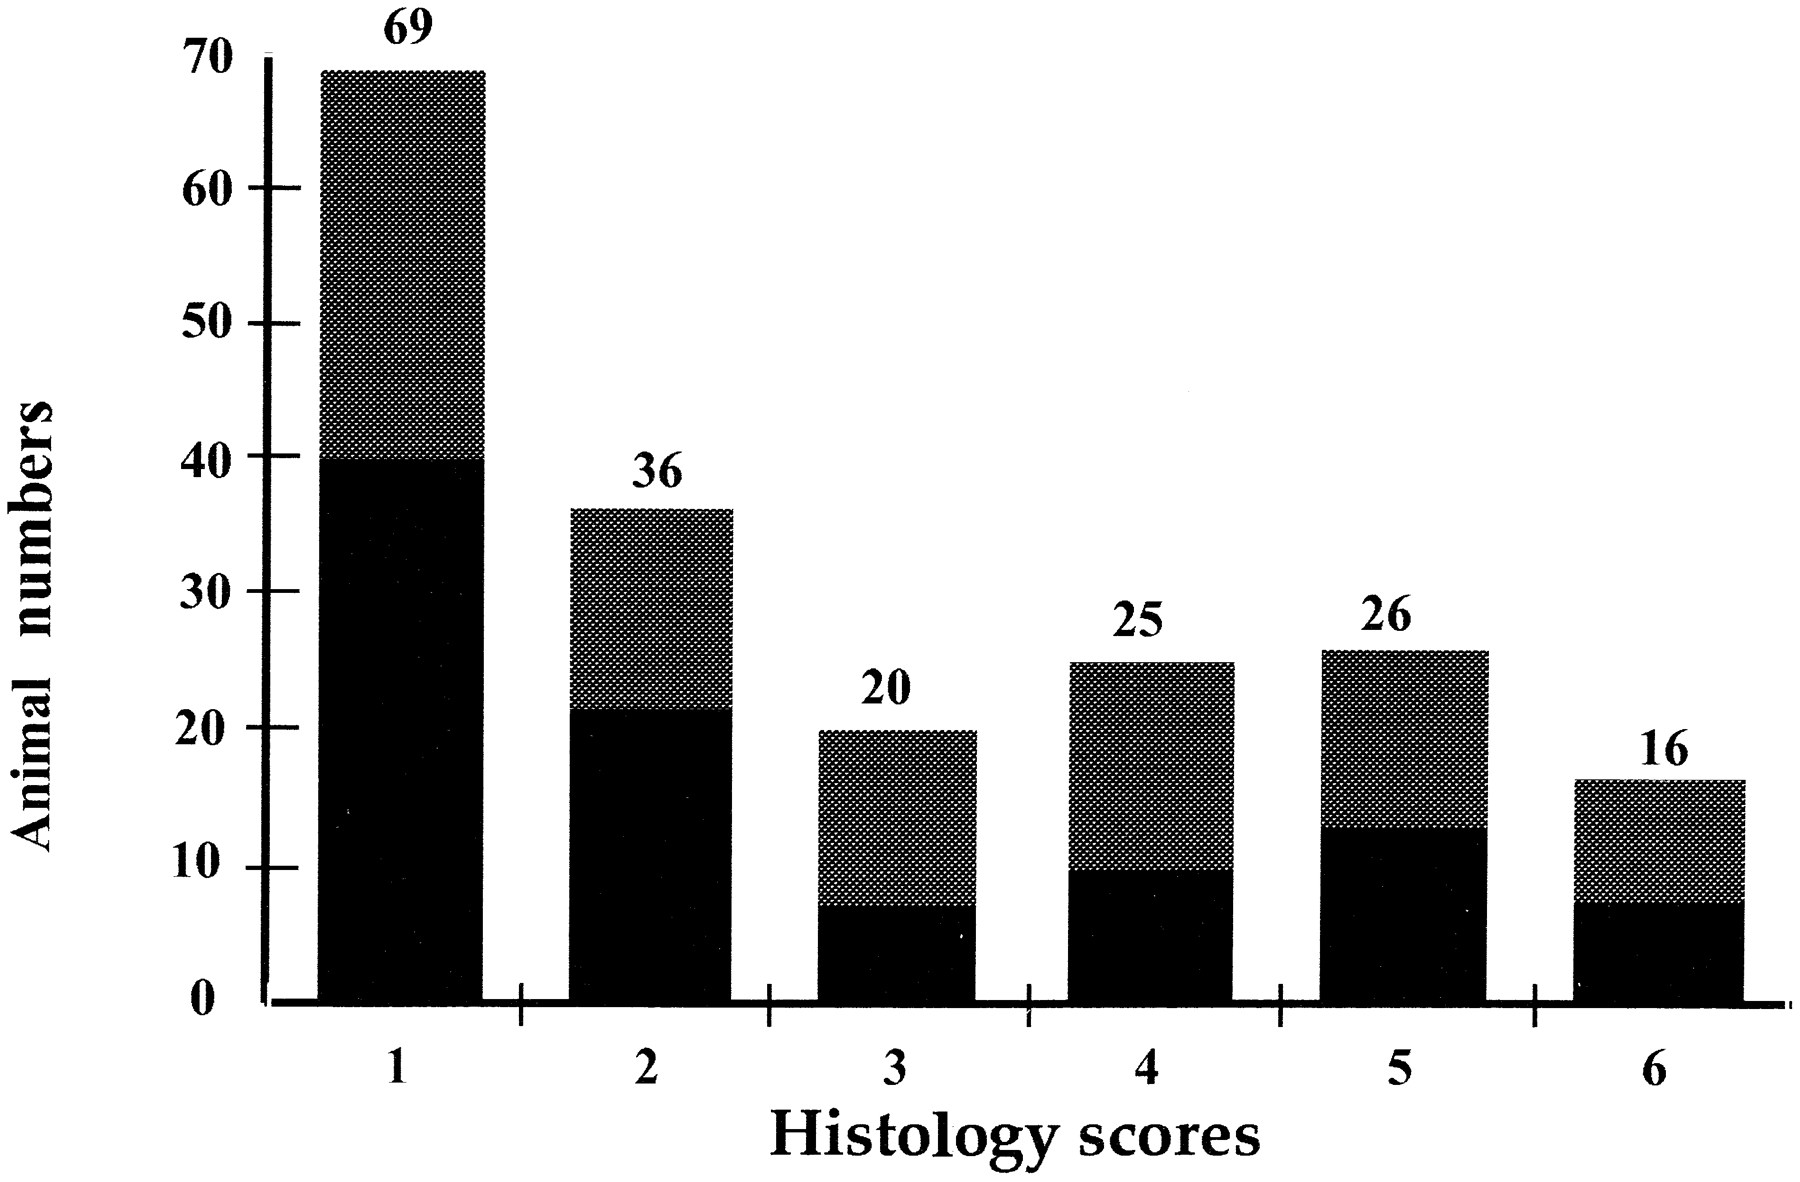
Figure 1.
Distribution of phenotypes in the BC1 progenies after CY treatment. Animal numbers are reported on the y-axis. Histology scores are 1–6 on the x-axis. (Shaded bars) Females; (solid bars) males.


