
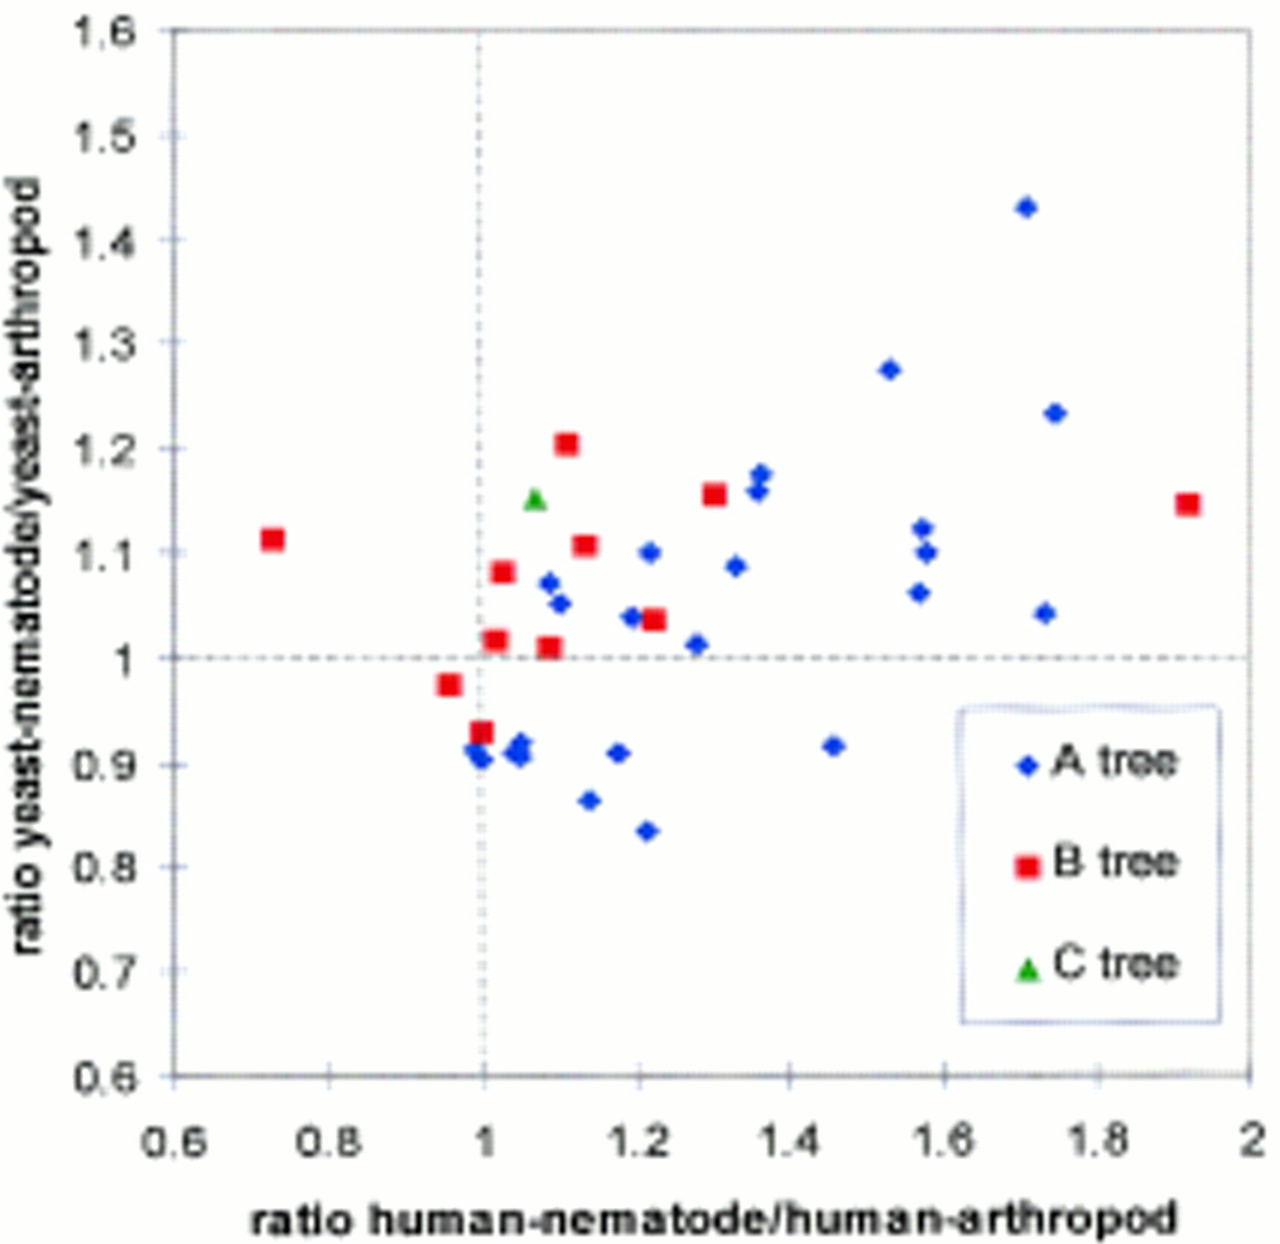
Four-way relative rate plot of evolutionary distances for 36 proteins. The ratio of evolutionary distances from (human–nematode)/(human–arthropod) for each protein is plotted on thex-axis, where a ratio of 1 would be expected if the proteins were evolving homogeneously in those branches assuming that arthropods and nematodes are sister taxa. The ratios of evolutionary distance from (yeast–nematode)/(yeast–arthropod) are plotted on they-axis, which should equal 1 if a protein evolved homogenously in the nematode and arthropod lineages. The position where thex-axis and y-axis both equal one represents the region where genes would fall if they evolved homogeneously in all four taxa, if Tree B is correct. Proteins to the right of the vertical line at x = 1 should favor tree A, proteins to the left should favor tree C, whereas proteins falling near the diagonal line should favor tree B. The distribution of the 36 orthologous proteins is skewed, with those that yield tree B (red squares) scattered uniformly around the diagonal line (with one exception, CDC42 supports tree B but falls to the extreme right of the graph), whereas all of the proteins that yield tree A (blue diamonds) are scattered to the right of the diagonal. The quartet favoring tree C is shown in green (triangle).


