
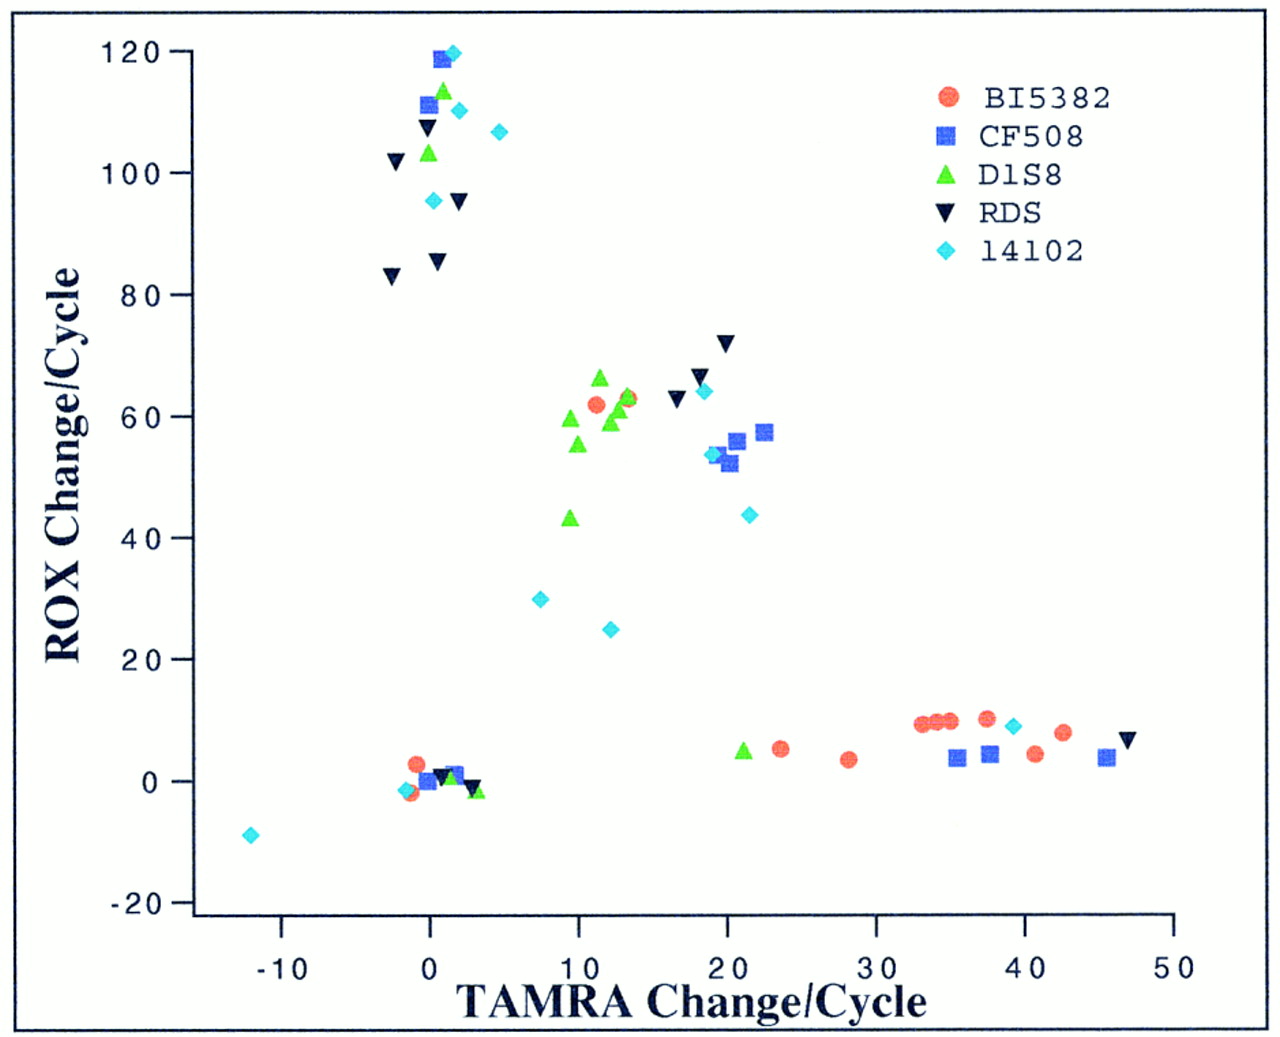
Figure 4.
Scatter plot of initial slopes of change in fluorescence intensities. The linearly normalized initial slopes of ROX and TAMRA fluorescence intensity changes of 60 samples (10 human genomic plus 2 salmon sperm DNA samples for each of the 5 markers/mutations) are plotted together. A normalization constant is used for each marker such that the data points can be plotted together on the same scale.


