
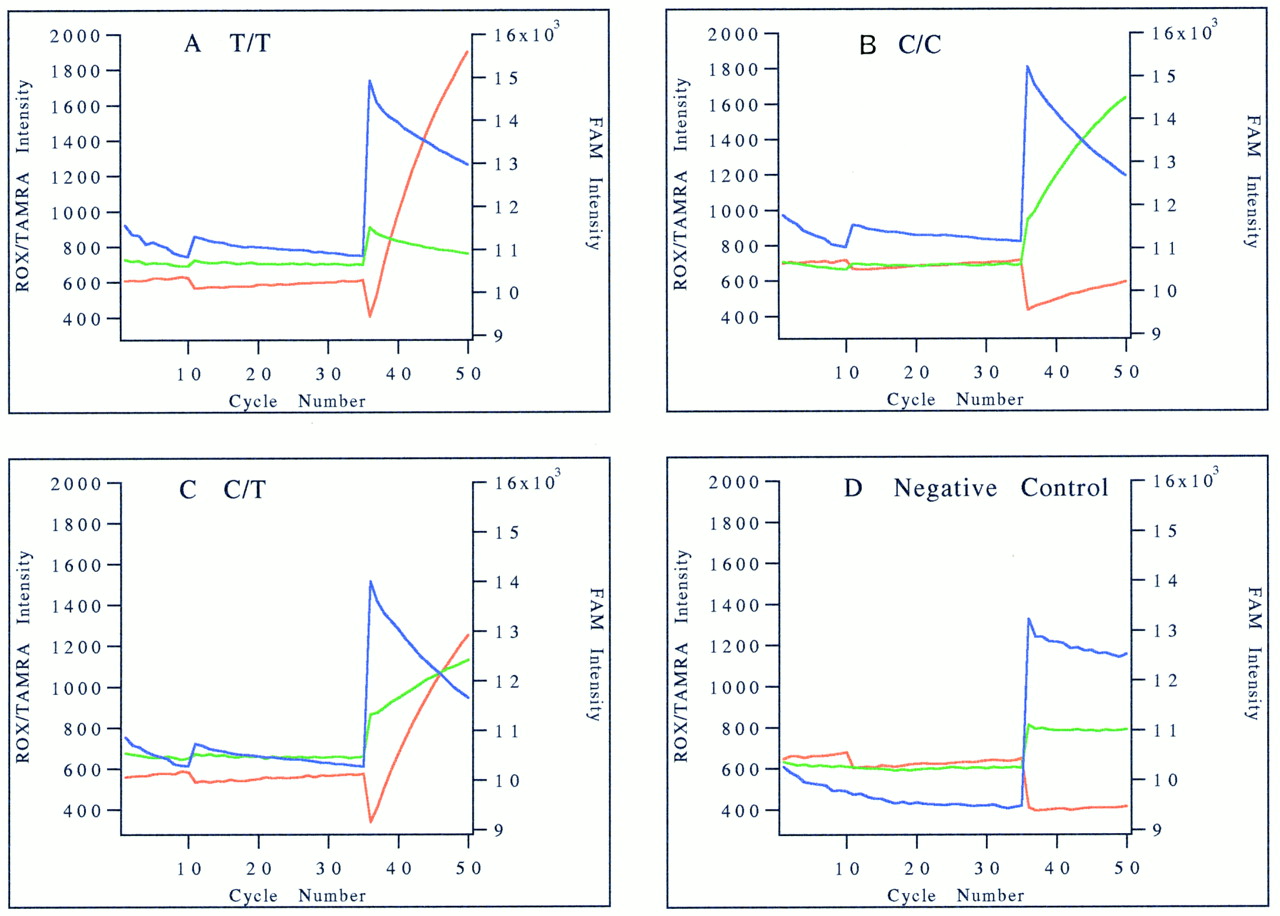
Figure 3.
Fluorescence intensity profiles of the PCR–DOL assay. The real-time fluorescence intensities of FAM (blue), ROX (red), and TAMRA (green) during PCR and ligation phases of the reaction are plotted against cycle number. The scale for ROX and TAMRA intensities is on theleft, and that for FAM intensity is on the right. The fluorescence intensity profiles of the same samples used for Fig. 2 are shown here. (A) Homozygous mutant sample; (B) homozygous normal control; (C) heterozygous carrier; (D) negative salmon sperm DNA control.


