
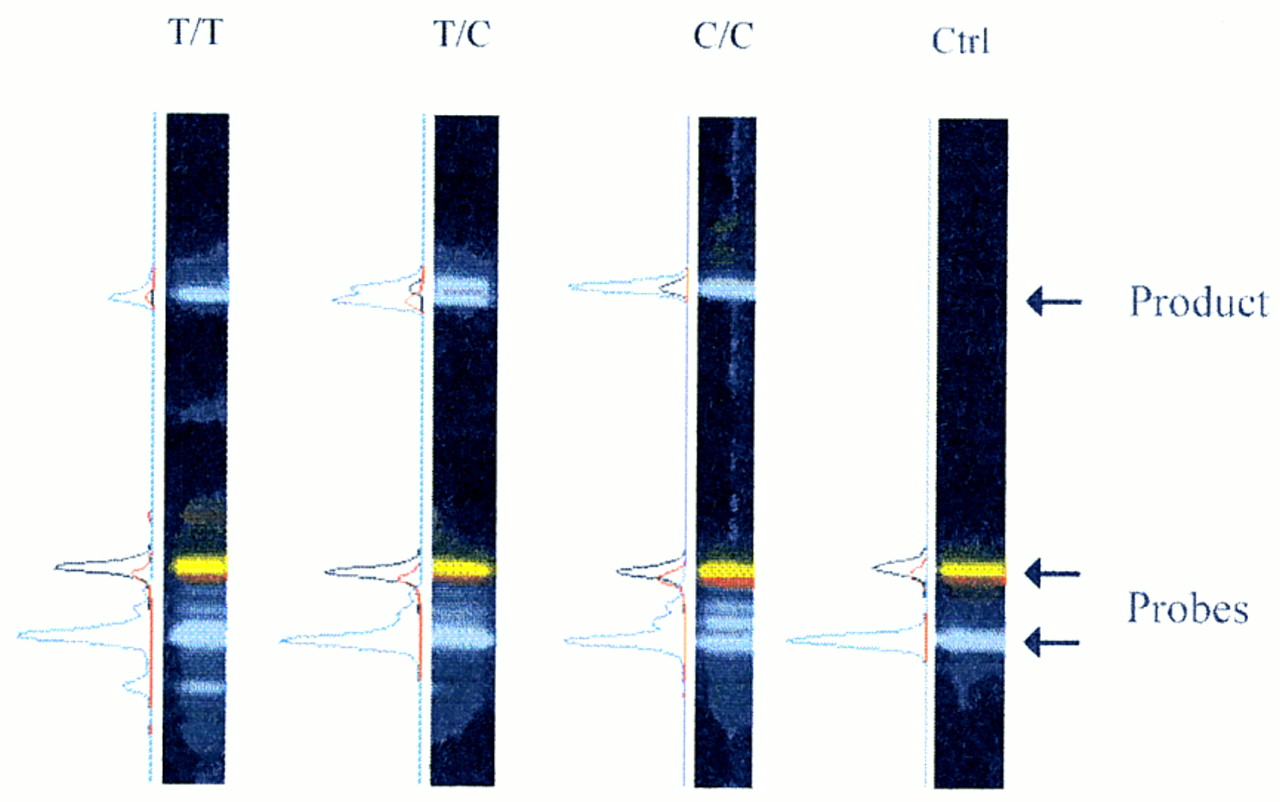
Gel image and electropherograms of PCR–DOL reaction mixtures. Four DNA samples were subjected to the PCR–DOL assay to test their mutational status for the C/T βo-thalassemia mutation. The unreacted ligation probes are found at the bottom of the gel image [(blue band) FAM-labeled common probe; (red band) ROX-labeled mutant T probe; (yellow band) TAMRA-labeled wild-type C probe]. The products are found near the top of the gel image, where the FAM–ROX ligation product migrates slightly faster than the FAM–TAMRA ligation product. The electropherogram of each lane is plotted alongside the gel image where the color scheme is the same as that for the gel image, except that the black peak represents the TAMRA label. (Lane 1) Homozygous mutant sample with a single product that is doubly labeled with FAM and ROX. (Lane 2) Heterozygous carrier with two products that are doubly labeled with FAM–TAMRA and FAM–ROX, respectively. (Lane 3) Homozygous normal control with a single product doubly labeled with FAM and TAMRA. Varying amounts of FAM-probe extension products (blue bands between the unreacted FAM and ROX/TAMRA probes) are seen in lanes 1–3. (Lane 4) Negative control salmon sperm DNA sample in which no ligation or extension products are seen.


